|
DOI: 10.7256/2453-8922.2024.3.71272
EDN: QWEIZV
Received:
17-07-2024
Published:
29-08-2024
Abstract:
The subject of the study is the ionic composition of syngenetic Late Pleistocene ice wedges: IW-17 and IW-20, located in Batagay yedoma. Both ice wedges consist of ultra-fresh ice with concentrations of major ions from 20 to 40 mg/L. For samples from ice, a method was used to measure the mass concentration of Ca2+, Mg2+, Na+, K+, NH4+ cations in samples of drinking, mineral, natural and waste water by ion chromatography FR.1.31.2005.01738. The range of detectable concentrations is 0.10-20.00 mg/L, and for the determination of anions, the method of measuring the mass concentration of Cl-, SO4-, NO3- in samples of drinking, mineral, natural and wastewater by ion chromatography FR.1.31.2005.01724 was used. The range of detectable concentrations is 0.10-20.00 mg/L and the method of measuring the mass concentration of ions in samples of natural, drinking and wastewater by ion chromatography HDPE F 14.1:2:4. 132-98 was used, the range of detectable concentrations for cations is 0.10-150.00 mg/L. Measuring instruments: ion chromatographic system "Stayer", detection limit for chloride ion 0.02 mg/L. The main results of the conducted research are, as follows: Sodium and calcium soluble cations significantly predominate in the ionic composition of IW-17, reaching 24.15 and 53.16 mg/L, respectively. In the same sample, chlorine anions reach 34.51 mg/L. The average concentration of sulfate soluble anions is 2-3 mg/L. Sodium and calcium cations significantly predominate in the ionic composition of IW-20, reaching 7.27 and 50.0 mg/L, respectively. In the same sample, chlorine anions reach 13.72 mg/L. The average concentration of sulfate anions is 2-4 mg/L, reaching 22.24 mg/L. The content of calcium soluble cations is 6-20 mg/L (calcium soluble cations rarely reaching 42-53 mg/L), the concentration of potassium cations is 0.7-3 mg/L. Sodium and calcium cations significantly predominate in the ionic composition of IW-20, reaching 7.27 and 50.0 mg/L, respectively, in one sample. In the same sample, chlorine anions reach 13.72 mg/L. The average concentration of sulfate anions is 2-4 mg/L, reaching 22.24 mg/L. The content of calcium soluble cations is 6-20 mg/L (rarely reach 42-53 mg/L), the concentration of potassium cations is 0.7-3 mg/L.
Keywords:
permafrost, ice wedge, Late Pleistocene, radiocarbon age, cryogeochemistry, ionic composition, major soluble ions, yedoma, Batagay, north of Yakutia
This article is automatically translated.
You can find original text of the article here.
Introduction The chemical composition of syncreogenic underground ice, according to the overwhelming majority of researchers, reflects the peculiarities of the hydrochemical situation at the time of their formation and serves as a reliable criterion for paleogeocryological constructions. To date, few data have been accumulated on the chemical composition of re-vein ice (PGL) in some regions of Russia[1-9] and North America.[10-13] For the Batagai edoma, the ionic composition was studied in several outcrops.[8,9] The purpose of this work is to analyze the ionic composition of the re-vein ice No. 17 and No. 20 of the Batagai edoma, to compare it with the Late Pleistocene PLL of other edomas and some Holocene strata. Results Field description and testing In September 2019, detailed geochemical and isotopic testing of two extended ice veins was performed on an outcrop in the mouth of the thermoerosion ravine opening into the southeastern part of the Batagai crater: IW-17-VV - and IW-20-VV in parallel to a depth of 13.1 m (Fig. 1), below - only along the vein IW-17-VV. The ice veins IW-17-VV and IW-20-VV of the Batagai edoma are located parallel to each other at a distance of 5 to 10 m and dissect the edoma thickness to a depth of more than 20 m. Ice samples from re-vein ice No. 17 and No. 20, exposed by the exposure of the Batagai ravine, were taken in August 2019. (Fig. 2) 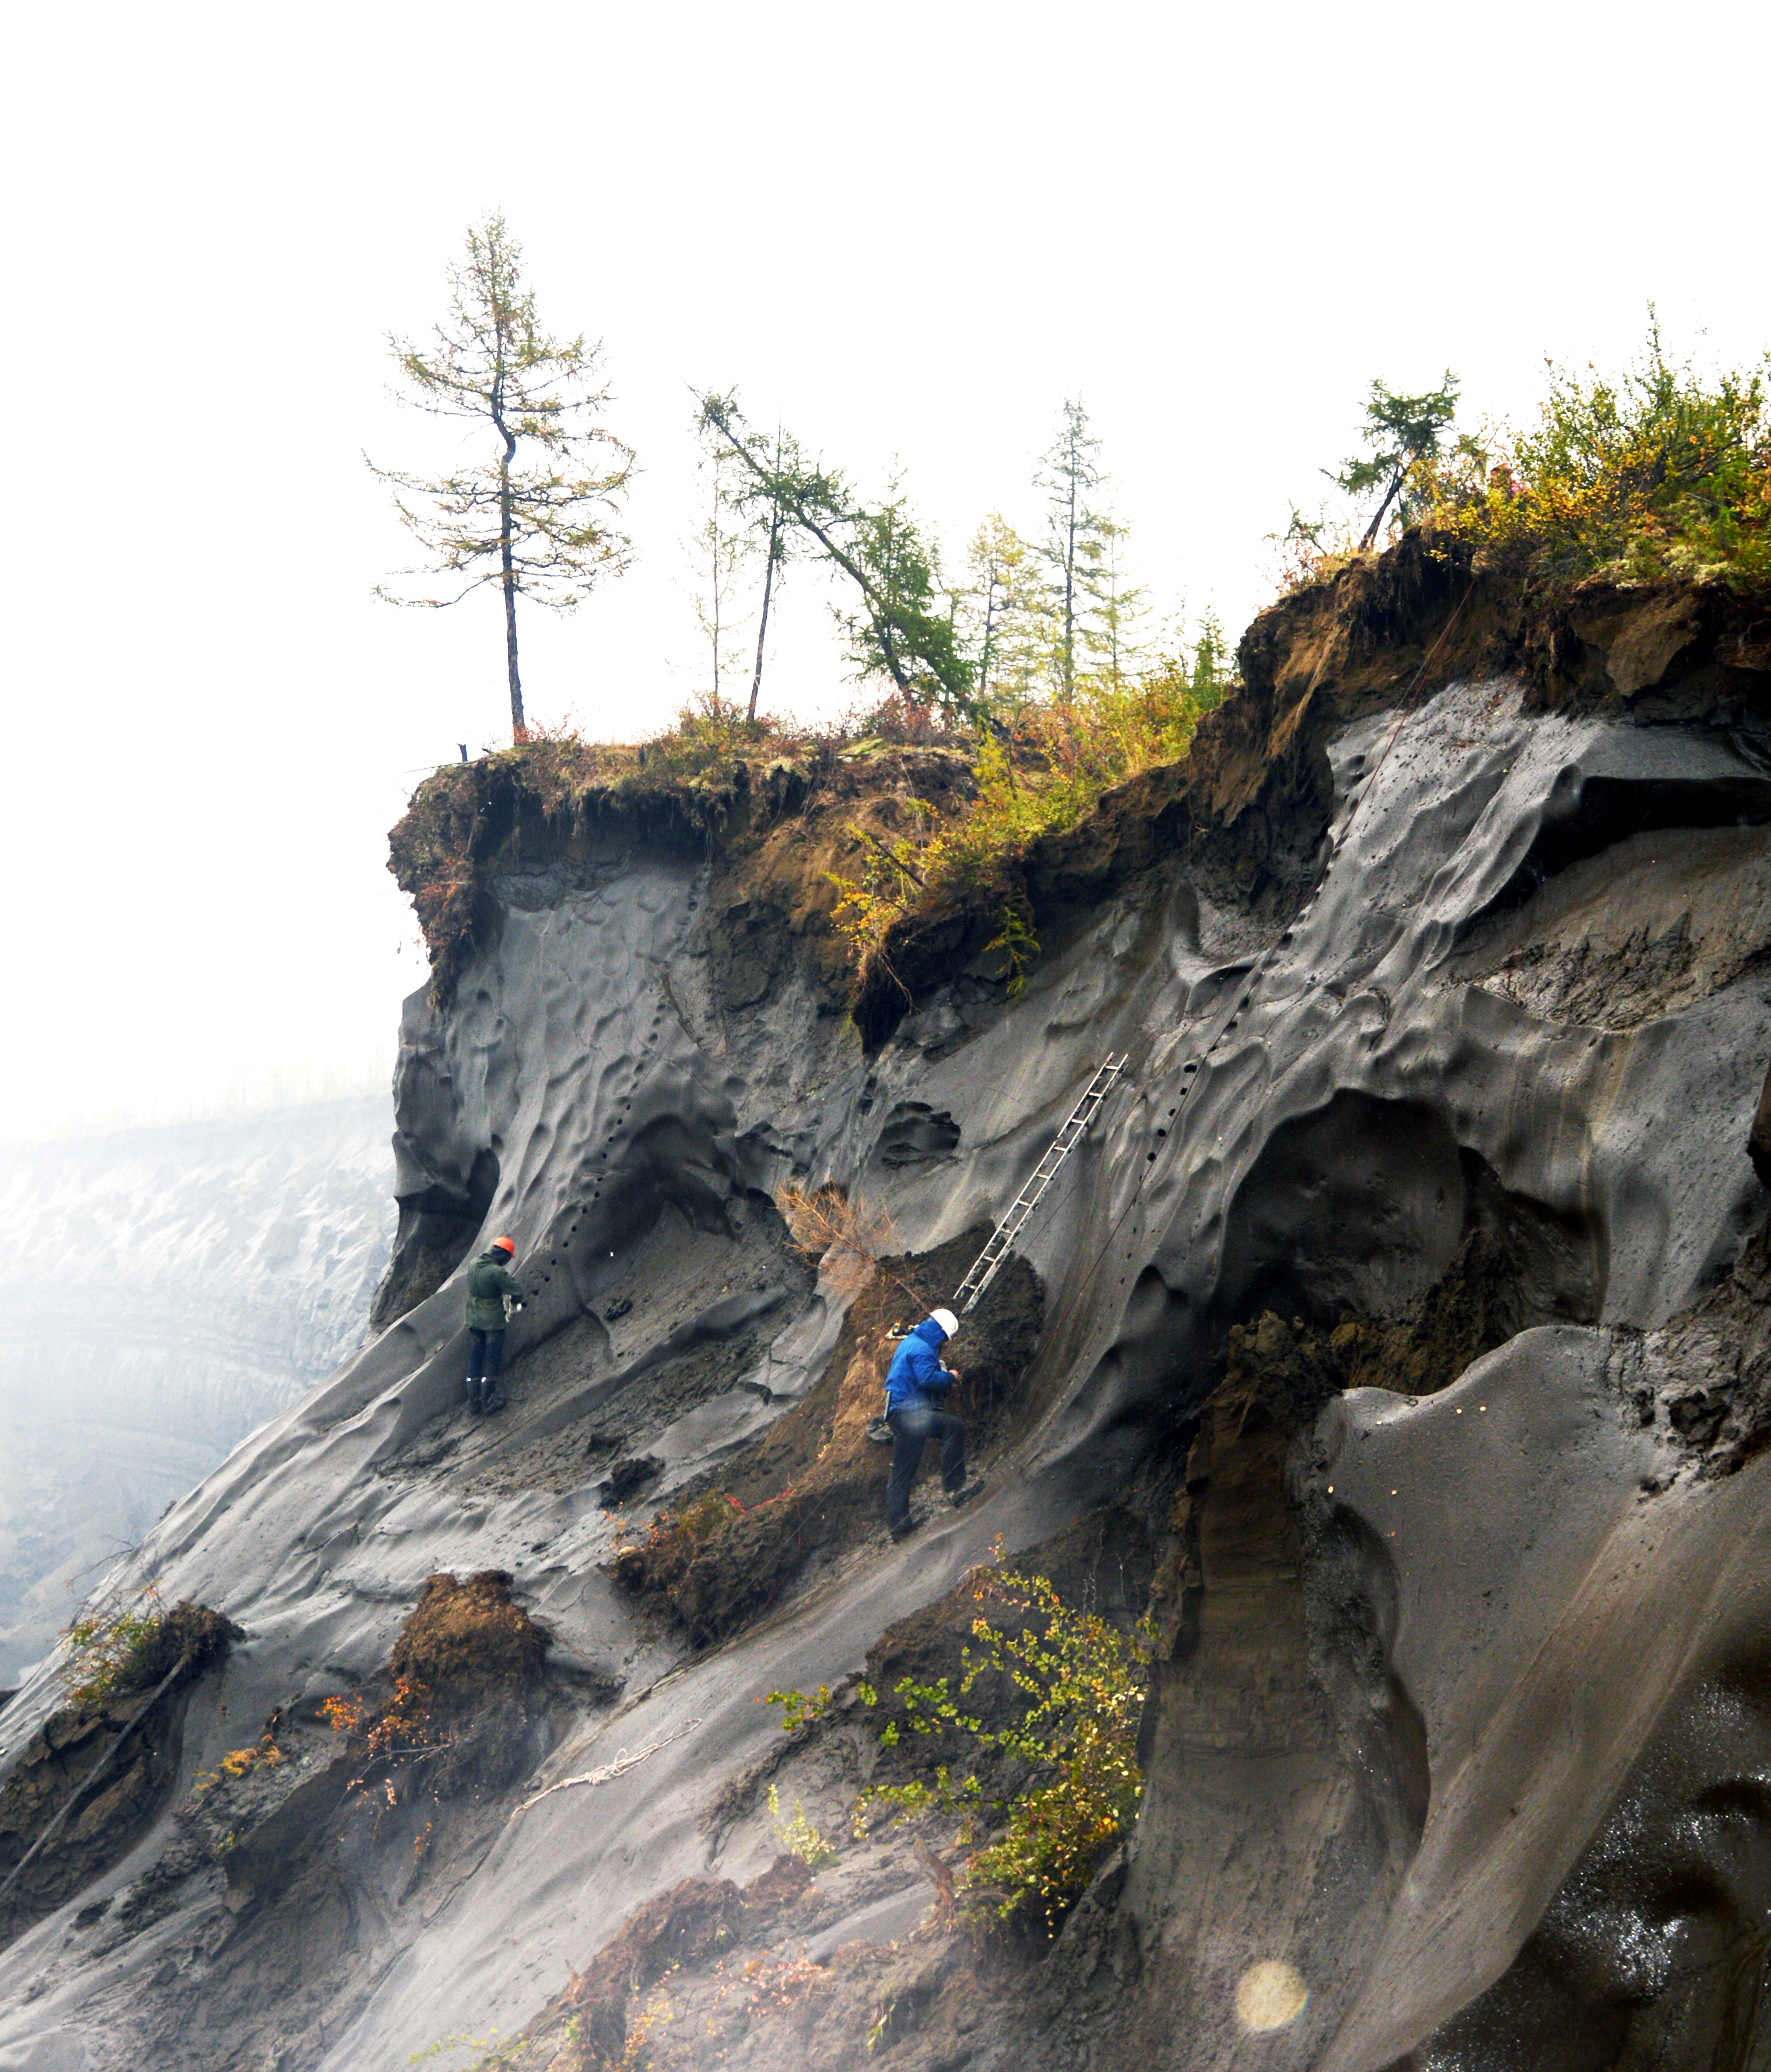
Fig. 1. Parallel simultaneous sampling of re-vein ice from two adjacent ice veins IW-17 (left) and IW-20 (right) of the Batagai ice column 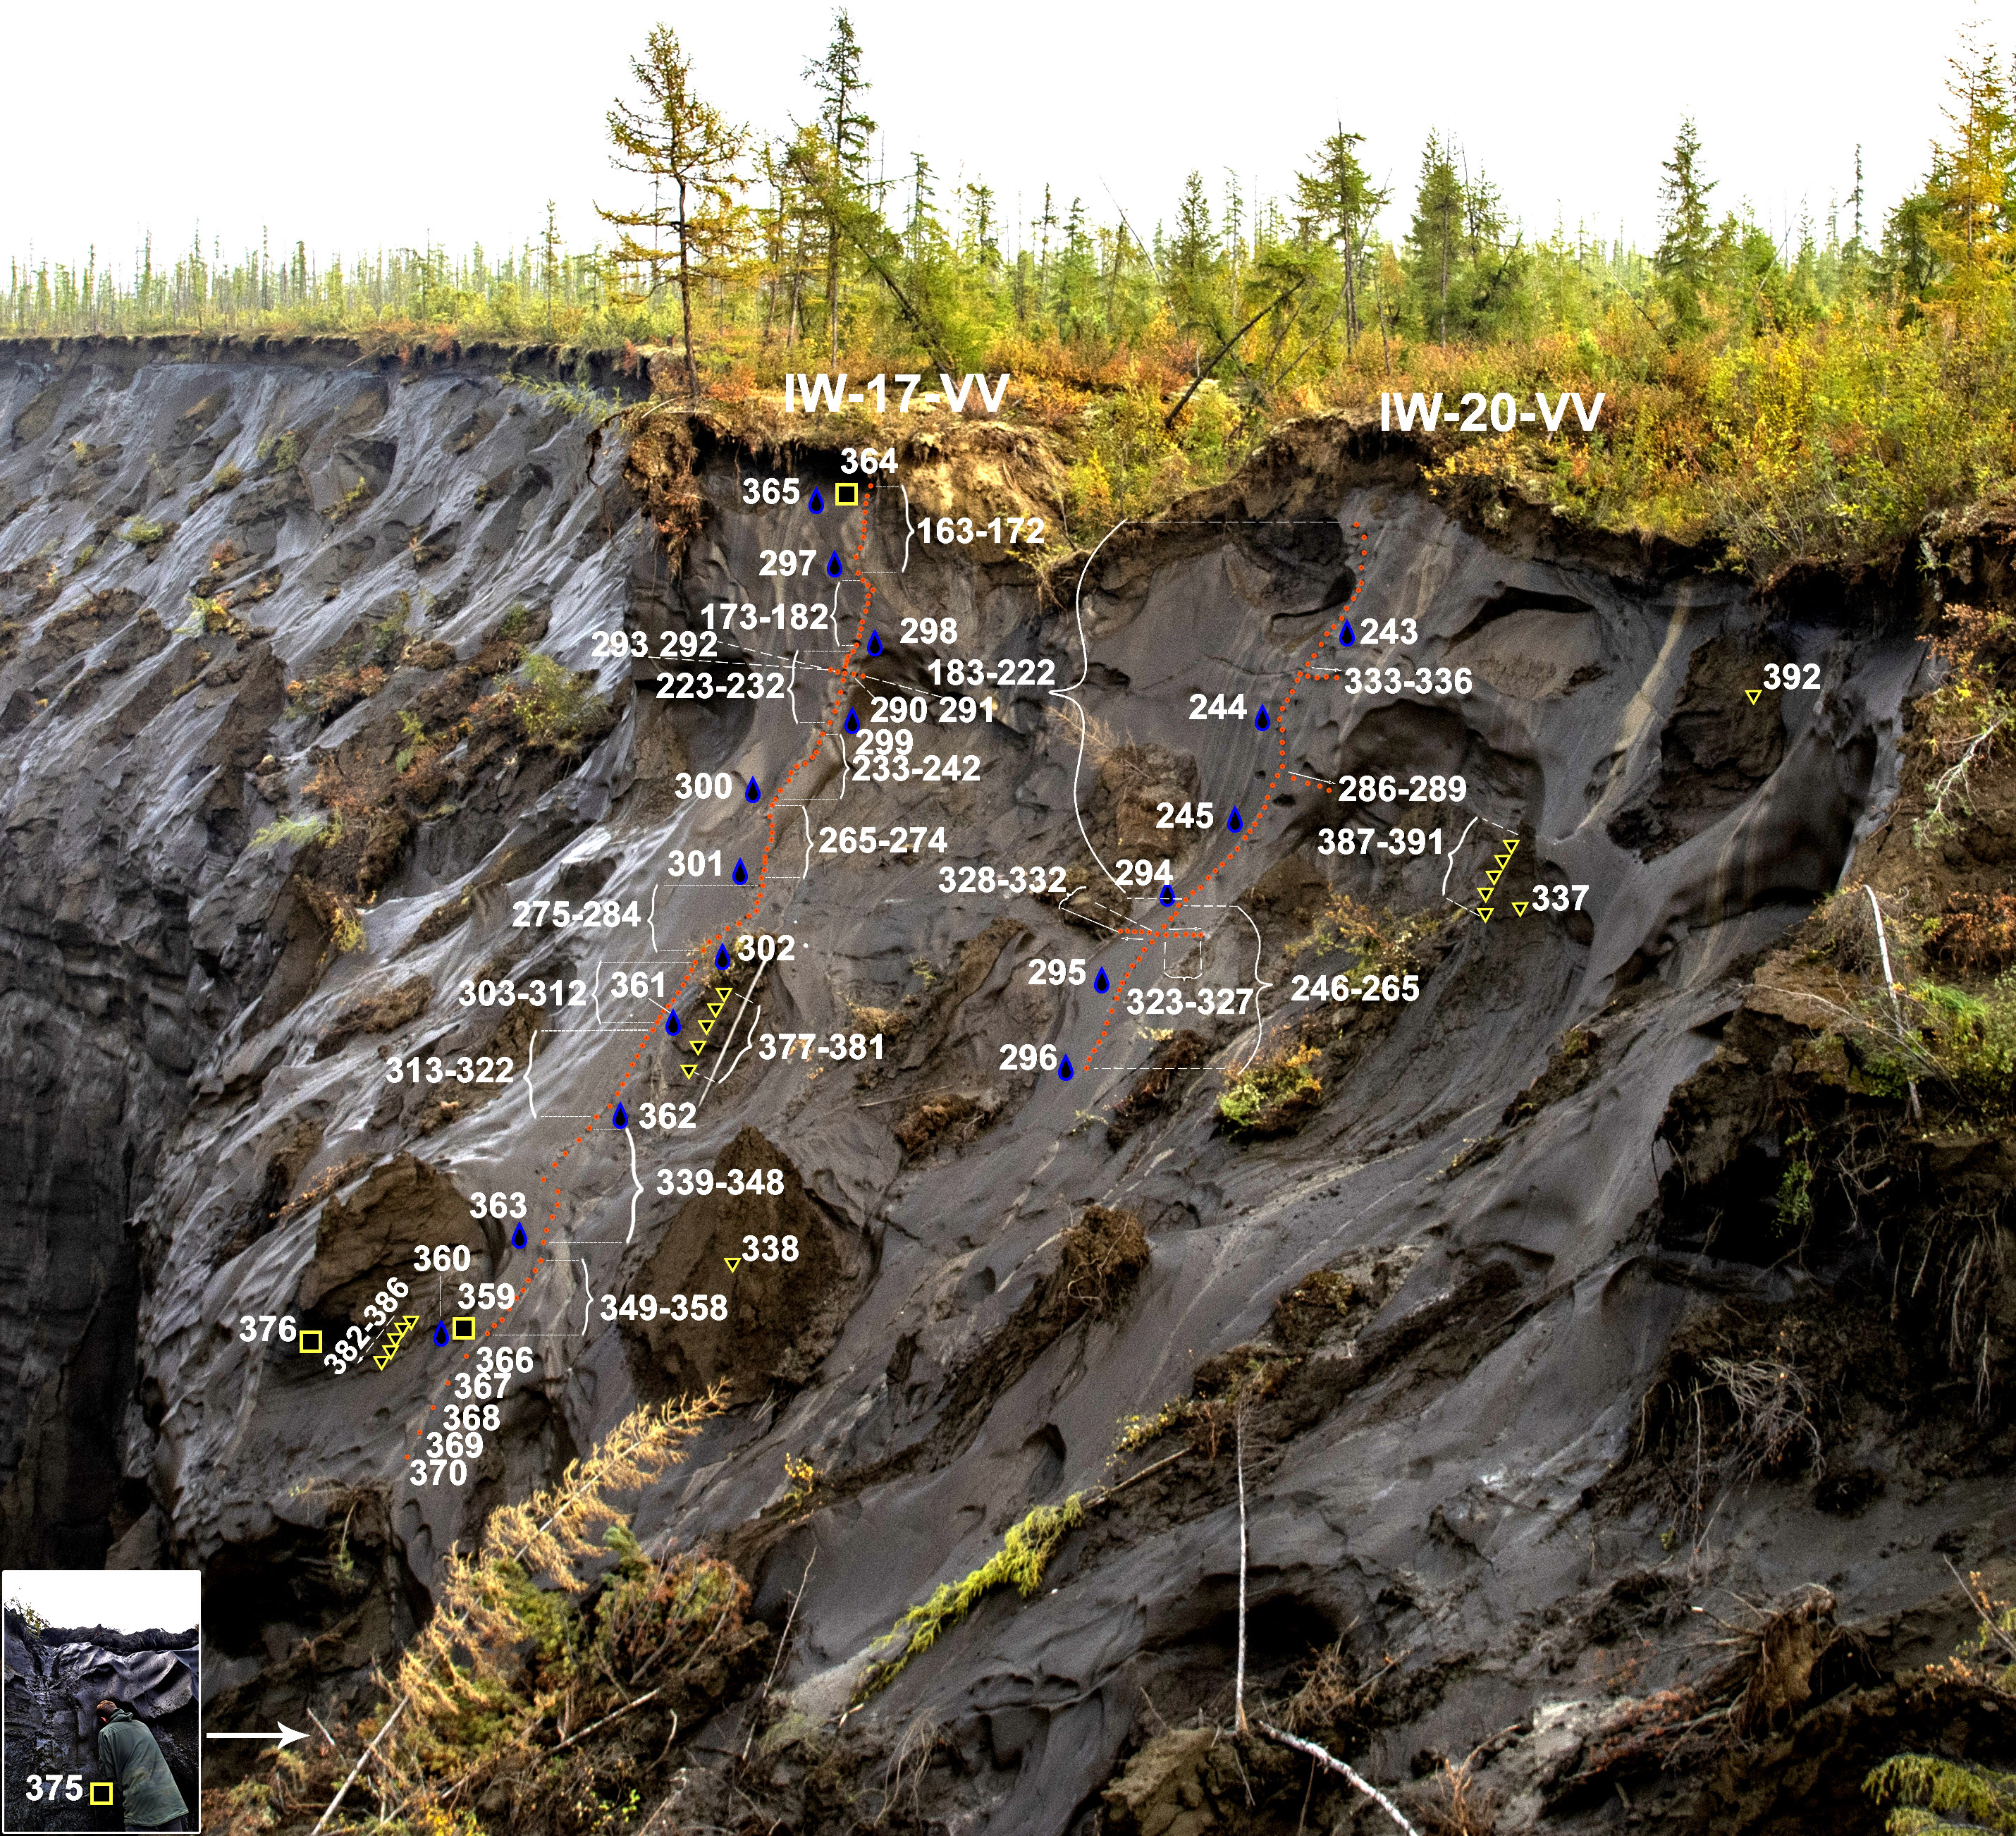
Fig. 2. Scheme of sampling from the re-vein ice IW-17 (left) and IW-20 (right) of the Batagai edom strata, performed in 2019: for isotopic and hydrochemical analyses: red dots from veins, yellow triangles from textured ice; for radiocarbon analysis – yellow squares 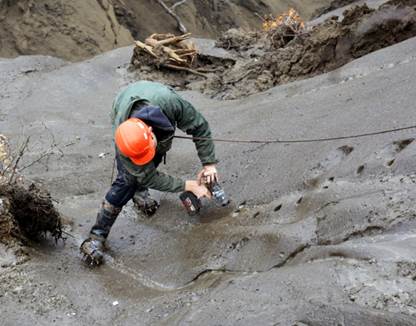
Fig. 3. Sampling of re-core ice using an electric drill from the IW-17 PPL of the Batagai edoma 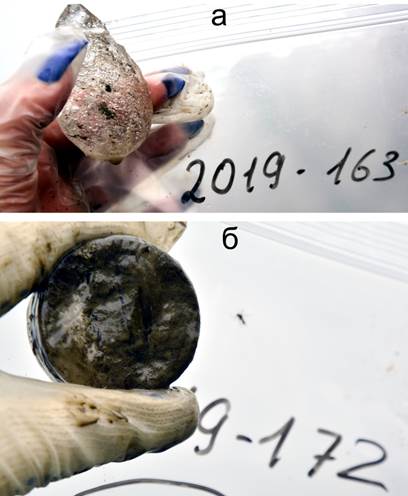
Fig. 4. Samples of re-vein ice, enriched to varying degrees with mineral and organogenic impurities from IW-17 of the Batagai edoma: a – pure upper sample No. 163 from a depth of 1.3 m (Na+ – 2.57 mg/l, Ca 2+ – 16.02, Cl - - 3.15 mg/l); b – the most saline sample of re-vein ice No. 17 – No. 172 from a depth of 3.1 m, highly enriched with mineral and organogenic impurities (Na+ – 24.15 mg/l, Ca 2+ – 53.16, Cl - - 34.51 mg/l) 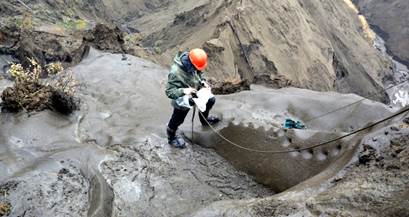
Fig. 5. Sampling of IW-17 re-vein ice in the depth range of 1.3-21.7 m of the Batagai edoma 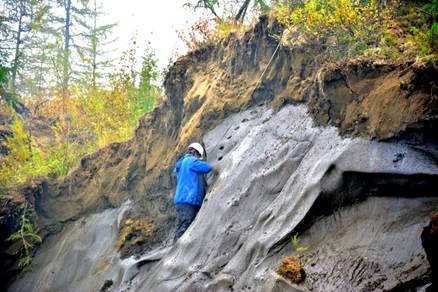
Fig. 6. Sampling of the Batagai edoma re-vein ice: IW-20 in the depth range of 1.3-9.1 m, IW-17 - up to a depth of 22.1 m. Description of re-vein ice Ice vein IW-17. The width of the IW-17 is 2.5 m. From top to bottom, the following are opened: 1.3-2.95 m - ice is predominantly transparent with a large number of vertically elongated bubbles of 3-4 mm in size and a low concentration of soil inclusions; 2.95-4.10 m - cloudy brown ice, high concentration of black and brown soil inclusions in the form of vertical veins, bubbles do not exceed 1 mm; 4.10-5.15 m - cloudy gray-brown ice with 3-5 mm bubbles elongated along the axis of the vein with a high concentration of soil inclusions; 5.15-5.95 m - transparent ice with few bubbles and soil inclusions; 5.95-7.7 m - cloudy brown ice with soil veins 8-9 cm; 7.7-8.1 m - brown vertically striped ice with a high concentration 8.1-9.35 m - transparent gray ice with bubbles and vertical inclusions of soil; 9.35-11.7 m - cloudy gray-brown ice with vertical inclusions of brown and light gray soil; 11.7-13.1 m - transparent dark gray ice with a high concentration of vertical inclusions of brown and light gray soil colors; 13.1-15.7 m - transparent brown-gray ice with a high concentration of bubbles and vertical inclusions of gray soil; 15.7-17.3 m - brown cloudy ice with a high concentration of vertical soil inclusions and bubbles.
The IW-20 ice vein. The width of the IW-20 PLL is 2.3 m. From top to bottom, the following are opened: 1.3- 4.10 m - gray ice is predominantly transparent with a large number of vertically elongated 3-4 mm bubbles and a low concentration of soil inclusions; 4.10-5.70 m cloudy gray-brown ice, high concentration of black and brown soil inclusions in in the form of vertical veins, bubbles not exceeding 1 mm are arranged randomly; 5.70-6.90 m - cloudy gray-yellow ice, high concentration of gray and yellowish-gray soil inclusions; 6.90-9.30 m - cloudy gray ice, high concentration of bubbles, vertical gray soil inclusions, 9.30-11.70 m - transparent ice gray-brown, vertical ground inclusions of gray color; 11.70-13.10 m - cloudy ice vertical ground inclusions of dark gray color clusters of bubbles along the inclusions. As follows from the description of the ice, only ice from the range of 1.3-5.15 m in IW-17 is similar in appearance to ice from the range of 1.3-5.70 m in IW-20; at the same time, an ice fragment in the range of 2.95-4.10 m in IW-17 differs from ice IW-20 at the same depth. Below, the ice veins vary significantly in color, in the color and size of vertical inclusions, as well as in the shape of bubbles. Methods Field methods Ice samples were taken vertically from ice veins, approximately every 10 cm, using Makita DDF481rte 18B and Bosch GSR 36 VE-2-LI drills with steel ice crowns with a diameter of 51 mm (Fig. 3), then selection was also performed in a number of horizontal profiles. Performing vertical and horizontal sampling of re-vein ice allows for more accurate comparison of spatial isotopic variations within different vein ice. To clean up the sampling site, the near-surface 2 cm of ice was removed using a drill and then deeper samples were taken from the same hole. An ice sample with a diameter of 5 cm. it was drilled out of the veins, while the mass of each sample was about 150 g and packed in plastic bags. Ice sampling was accompanied by a detailed description of the color, transparency, structure, thickness of ice and soil veins, inclusions, shape and size of xenoliths, air bubbles (Fig. 4). The coordinates of the sections were recorded using GPS. With a high degree of detail at the same depths, 2 vertical transects were selected to a depth of 13.10 m. This made it possible to compare hydrochemical characteristics in the depth range from 1 to 13.1 m. Samples were also taken from the lower part of the IW-17 vein in the depth range from 13.3 to 22.1 m. In addition, additional samples were selected for 4 horizontal profiles, the results of which were used for control. Laboratory methods Measurements of the macrocomponent composition of ice were carried out using the ion chromatograph "Steyer" (Russia), the detection limit for chloride ion is 0.02 mg/l. The ion chromatograph "Steyer" is designed for qualitative and quantitative determination of inorganic compounds F-, Cl-, NO 3-, NO 2-, SO 4 2-, PO 4 3-, Na+. NH 4+, K+, Mg 2+ and Ca 2+ in aqueous solutions of various origins (natural, industrial, drinking, including bottled). His device includes an isocratic pump, a conductometric detector, a separation column, a background conduction suppression system and a computer kit for collecting, processing and storing chromatographic data. For samples from recycled ice, a method was used to measure the mass concentration of Ca 2+, Mg 2+, Na+, K+, NH 4+ cations in samples of drinking, mineral, natural and waste water by ion chromatography FR.1.31.2005.01738. The range of detectable concentrations is 0.10-20.00 mg/dm3, and for the determination of anions, a method was used for measuring the mass concentration of Cl-, SO 4 2-, NO 3- in samples of drinking, mineral, natural and wastewater by ion chromatography FR.1.31.2005.01724, the range of detectable concentrations is 0.10-20.00 mg/dm3 and a method for measuring the mass concentration of ions in samples of natural, drinking and wastewater by ion chromatography HDPE F 14.1:2:4. 132-98. The range of determined concentrations for cations is 0.10-150.00 mg/dm3. Results Radiocarbon age According to unidentified organic microstates in the IW-17 ice using AMS, 4 radiocarbon dating was obtained[14]: a Holocene date of 10510 thousand cal years was obtained from sandy loam with organic inclusions directly above the vein at a depth of 1.30 m, a date of 26140 thousand cal years was obtained from the axial part of the ice vein at a depth of 3.3 m, at a depth of 12.3 m (due to a change in the opening angle of the ice vein, the sample was taken 0.5 m to the left of the axis of the vein), its 14 With age was 29,100 thousand cal. years, at a depth of 21.1 m in the lower part of the IW, the sample was taken from the axial part, its 14 With age was 42,220 thousand cal. years. The new AMS radiocarbon dating obtained allows us to conclude with a high degree of probability that the examined powerful syngenetic re-vein ice, opening in the upper 20-meter part of the outcrop of the Batagai edoma, began to accumulate no later than 42 thousand cal. years ago, and completed the formation of about 11.7 thousand cal. years ago. Thus, ice veins in the upper Batagai ice complex in the central part of the outcrop have accumulated over the course of 30 thousand years. IW-3 is dated in some detail on the opposite wall of the ravine[15]. 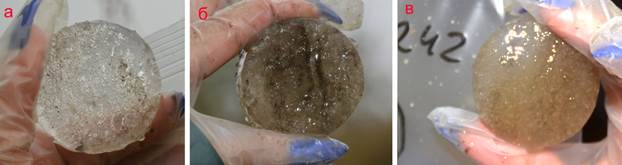
{pictory7}
Fig. 7. The least saline samples of re-vein ice IW-17 of the Batagai edoma: a – B-VV/2019-165 (Na+ – 1.91 mg/l, Ca 2+ – 8.72, Cl- - 2.45 mg/l) from a depth of 1.7 m; b – B-VV/2019-227 (Na+ – 0.93 mg/l, Ca 2+ – 17.19, Cl- - 1.32 mg/l) from a depth of 6.1 m; b – B-VV/2019-242 (Na+ – 0.93 mg/L, Ca 2+ – 13.01 mg/L, Cl - - 0.90 mg/l) from a depth of 9.1 m (see also Fig. 4, a) 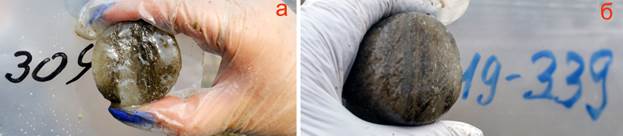
{figure 8} Fig. 8. The most saline samples of the IW-17 re-vein ice of the Batagai edoma: a – B-VV/2019-304 (Na+ – 4.94 mg/l, Ca 2+ – 53.05, Cl- - 2.15 mg/l) from a depth of 13.5 m; b – B-VV/2019-339 (Na+ – 5.07 mg/l, Ca 2+ – 40.96 mg/l, Cl- - 6.14 mg/l) from a depth of 16.9 m (see also Fig. 4, b) Ionic composition of PPL Both ice veins belong to ultra-fresh ice with a concentration of basic ions from 20 to 40 mg/l.
Sodium and calcium cations significantly predominate in the ionic composition of the IW-17 re-vein ice, reaching 24.15 and 53.16 mg/l, respectively, in one of the samples. In the same sample, chlorine anions reach 34.51 mg/l. The average concentration of sulfate anions is 2-3 mg/l (Table 1, Fig. 9). The presence of nitrate anions in the composition of IW-17 is noticeable, amounting mainly to 4-7 mg/l at extreme NO 3 - reaches 16 and even 26 mg/l at a depth of 12.5 m.
Sodium and calcium cations significantly predominate in the ionic composition of the IW-20 re-vein ice, reaching 7.27 and 50.0 mg/l, respectively, in one of the samples. In the same sample, chlorine anions reach 13.72 mg/l. The average concentration of sulfate anions is 2-4 mg/l, reaching 22.24 mg/l (Table 2, Fig. 10). The noticeable presence of nitrate anions in the composition of IW-20 is noteworthy, they are mainly 6-8 mg/l and reach a depth of 7-8 m - 13 mg/l. The content of calcium cations is 6-20 mg/l (rarely reaching 42-53 mg/l), the concentration of potassium cations is 0.7-3 mg/l (see Table 1.2; see Fig. 9.10). Table 1. Ionic composition of Late Pleistocene re-vein ice IW-17, Batagai edoma | Field Number sample | Chapter, m | EU, msm | Na+, mg/l | K+, mg/l | Mg 2+, mg/l | Ca 2+, mg/l | F, mg/l | Cl-, mg/l | NO. 3-, mg/l | SO 4 2-, mg/l |
| B-VV/ 2019-163 | 1,3 | 102 | 2,57 | 1,72 | 2,95 | 16,02 | 0,42 | 3,15 | 5,26 | 2,68 | | B-VV/ 2019-164 | 1,5 | 84 | 1,20 | 1,27 | 2,32 | 12,56 | 0,28 |
2,20 | 5,50 | 1,14 | | B-VV/ 2019-165 | 1,7 | 73 | 1,91 | 1,25 | 1,74 | 8,72 | 0,17 | 2,45 | 8,05 | 1,06 | | B-VV/ 2019-166 | 1,9 | 108 | 3,57 | 2,83 |
3,59 | 28,90 | 0,35 | 4,60 | 7,87 | 4,30 | | B-VV/ 2019-167 | 2,1 | 110 | 4,16 | 1,17 | 4,45 | 22,66 | 0,30 | 4,30 | 6,18 | 3,87 | | B-VV/ 2019-168 | 2,3 |
129 | 2,86 | 1,36 | 4,64 | 27,66 | 0,25 | 2,26 | 5,05 | 7,01 | | B-VV/ 2019-169 | 2,5 | 100 | 2,35 | 1,24 | 3,28 | 17,00 | 0,26 | 2,15 | 5,68 |
3,84 | | B-VV/ 2019-171 | 2,9 | 136 | 3,90 | 1,93 | 8,02 | 42,24 | 0,47 | 3,88 | 7,06 | 4,20 | | B-VV/ 2019-172 | 3,1 | 390 | 24,15 | 1,38 | 17,64 | 53,16 |
1,10 | 34,51 | 8,48 | 30,47 | | B-VV/ 2019-297 | 3,2 | - | 2,72 | 1,75 | 3,56 | 20,48 | 0,32 | 2,41 | 0,16 | 4,18 | | B-VV/ 2019-173 | 3,3 | 116 | 3,59 |
0,91 | 4,57 | 40,16 | 0,43 | 3,92 | 5,78 | 4,80 | | B-VV/ 2019-174 | 3,5 | 133 | 4,10 | 1,09 | 6,55 | 39,52 | 0,62 | 2,11 | 6,39 | 4,68 | | B-VV/ 2019-175 |
3,7 | 130 | 2,48 | 0,92 | 5,46 | 27,98 | 0,34 | 1,86 | 14,24 | 3,88 | | B-VV/ 2019-176 | 3,9 | 96 | 1,63 | 1,40 | 4,08 | 28,47 | 0,36 | 1,92 |
6,09 | 2,43 | | B-VV/ 2019-177 | 4,1 | 93 | 2,02 | 1,39 | 3,27 | 20,95 | 0,17 | 1,35 | 4,80 | 2,62 | | B-VV/ 2019-178 | 4,3 | 109 | 1,86 | 1,34 | 3,47 |
24,80 | 0,22 | 1,40 | 3,92 | 3,17 | | B-VV/ 2019-179 | 4,5 | 143 | 2,36 | 2,40 | 5,39 | 38,74 | 0,34 | 1,48 | 4,75 | 3,07 | | B-VV/ 2019-180 | 4,7 | 122 |
2,09 | 2,67 | 4,49 | 29,01 | 0,22 | 1,51 | 4,32 | 2,43 | | B-VV/ 2019-181 | 4,9 | 129 | 2,36 | 1,13 | 5,62 | 42,30 | 0,44 | 1,56 | 6,75 | 3,10 |
| B-VV/ 2019-182 | 5,1 | 118 | 2,53 | 1,94 | 3,95 | 32,71 | 0,32 | 2,03 | 6,41 | 2,62 | | B-VV/ 2019-298 | 5,2 | - | 2,17 | 1,87 | 4,23 | 18,42 | 0,44 |
2,87 | 0,25 | 2,26 | | B-VV/ 2019-223 | 5,3 | 113 | 1,70 | 1,38 | 4,18 | 30,51 | 0,24 | 1,33 | 4,07 | 2,94 | | B-VV/ 2019-224 | 5,5 | 89 | 1,37 | 0,90 |
2,77 | 18,21 | 0,20 | 1,70 | 4,10 | 2,01 | | B-VV/ 2019-225 | 5,7 | 92 | 1,08 | 1,33 | 3,21 | 20,78 | 0,21 | 1,42 | 4,60 | 1,81 | | B-VV/ 2019-226 | 5,9 |
80 | 1,12 | 1,60 | 2,15 | 13,54 | 0,10 | 1,20 | 3,49 | 1,42 | | B-VV/ 2019-227 | 6,1 | 83 | 0,93 | 1,56 | 2,94 | 17,19 | 0,13 | 1,32 | 4,32 |
2,26 | | B-VV/ 2019-228 | 6,3 | 100 | 1,42 | 1,40 | 4,41 | 28,81 | 0,17 | 1,27 | 4,50 | 2,61 | | B-VV/ 2019-229 | 6,5 | 96 | 1,16 | 1,34 | 3,63 | 25,08 |
0,18 | 1,11 | 5,35 | 2,53 | | B-VV/ 2019-230 | 6,7 | 72 | 1,43 | 1,57 | 2,41 | 13,90 | 0,12 | 1,08 | 3,63 | 1,63 | | B-VV/ 2019-231 | 6,9 | 88 | 1,26 |
1,32 | 2,60 | 17,14 | 0,14 | 1,21 | 5,14 | 1,81 | | B-VV/ 2019-232 | 7,1 | 88 | 1,06 | 2,20 | 2,82 | 17,29 | 0,13 | 1,50 | 2,09 | 1,97 | | B-VV/ 2019-299 |
7,2 | - | 1,90 | 2,00 | 2,81 | 20,42 | 0,24 | 2,57 | 0,23 | 2,71 | | B-VV/ 2019-233 | 7,3 | 91 | 1,80 | 1,46 | 2,88 | 21,07 | 0,19 | 2,48 |
7,50 | 2,23 | | B-VV/ 2019-234 | 7,5 | 102 | 0,62 | 1,17 | 2,71 | 21,48 | 0,17 | 1,27 | 14,32 | 1,83 | | B-VV/ 2019-235 | 7,7 | 245 | 1,29 | 1,48 | 3,53 |
22,88 | 0,22 | 1,77 | 15,13 | 2,32 | | B-VV/ 2019-236 | 7,9 | 132 | 1,10 | 1,33 | 3,70 | 22,30 | 0,17 | 1,57 | 15,63 | 2,08 | | B-VV/ 2019-237 | 8,1 | 111 |
1,17 | 1,30 | 3,38 | 22,90 | 0,12 | 1,57 | 9,18 | 2,63 | | B-VV/ 2019-238 | 8,3 | 116 | 1,67 | 1,57 | 4,08 | 21,16 | 0,19 | 1,14 | 3,75 | 2,34 |
| B-VV/ 2019-239 | 8,5 | 116 | 2,20 | 2,76 | 4,41 | 19,74 | 0,18 | 2,27 | 4,23 | 2,51 | | B-VV/ 2019-240 | 8,7 | 101 | 1,05 | 1,68 | 3,15 | 17,11 | 0,15 |
1,26 | 4,32 | 1,76 | | B-VV/ 2019-241 | 8,9 | 95 | 1,31 | 1,02 | 3,30 | 17,30 | 0,17 | 0,97 | 3,01 | 2,01 | | B-VV/ 2019-242 | 9,1 | 71 | 0,73 | 1,18 |
2,60 | 13,01 | 0,10 | 0,90 | 2,71 | 1,20 | | B-VV/ 2019-266 | 9,3 | 95 | 1,26 | 1,79 | 3,01 | 18,18 | 0,17 | 1,10 | 3,33 | 2,36 | | B-VV/ 2019-267 | 9,5 |
131 | 2,37 | 1,76 | 5,06 | 37,09 | 0,24 | 1,44 | 4,53 | 4,61 | | B-VV/ 2019-268 | 9,7 | 84 | 0,66 | 1,38 | 2,41 | 15,80 | 0,13 | 1,06 | 3,91 |
1,61 | | B-VV/ 2019-269 | 9,9 | 86 | 0,77 | 1,67 | 2,76 | 18,67 | 0,10 | 1,05 | 3,57 | 2,08 | | B-VV/ 2019-270 | 10,1 | 119 | 1,90 | 2,43 | 4,57 | 31,97 |
0,19 | 2,18 | 4,61 | 3,18 | | B-VV/ 2019-271 | 10,3 | 142 | 2,55 | 1,67 | 5,75 | 38,64 | 0,22 | 2,01 | 4,63 | 4,80 | | B-VV/ 2019-272 | 10,5 | 148 | 3,65 |
1,61 | 6,78 | 47,60 | 0,24 | 2,32 | 4,78 | 9,71 | | B-VV/ 2019-301 | 10,6 | - | 1,39 | 1,57 | 5,57 | 28,78 | 0,31 | 1,70 | 0,10 | 3,94 | | B-VV/ 2019-273 |
10,7 | 107 | 1,33 | 1,25 | 4,64 | 35,03 | 0,22 | 1,51 | 4,32 | 2,43 | | B-VV/ 2019-274 | 10,9 | 118 | 2,57 | 1,09 | 4,73 | 27,11 | 0,24 | 1,12 |
3,47 | 2,15 | | B-VV/ 2019-275 | 11,1 | 108 | 1,03 | 1,31 | 3,72 | 29,57 | 0,19 | 0,94 | 3,46 | 2,43 | | B-VV/ 2019-276 | 11,3 | 92 | 0,87 | 1,85 | 3,22 |
18,91 | 0,13 | 1,21 | 1,70 | 2,14 | | B-VV/ 2019-277 | 11,5 | 82 | 2,02 | 1,32 | 3,13 | 17,40 | 0,17 | 2,73 | 3,95 | 3,04 | | B-VV/ 2019-278 | 11,7 | 92 |
1,70 | 1,66 | 2,86 | 19,80 | 0,16 | 1,60 | 3,03 | 2,52 | | B-VV/ 2019-279 | 11,9 | 98 | 1,04 | 1,27 | 4,13 | 28,08 | 0,17 | 1,65 | 3,50 | 4,58 |
| B-VV/ 2019-280 | 12,1 | 142 | 2,76 | 1,55 | 6,45 | 47,56 | 0,23 | 1,07 | 8,46 | 4,98 | | B-VV/ 2019-281 | 12,3 | 91 | 1,23 | 1,23 | 3,01 | 18,90 | 0,16 |
1,62 | 6,36 | 2,55 | | B-VV/ 2019-282 | 12,5 | 169 | 2,27 | 7,42 | 5,26 | 48,41 | 0,33 | 2,56 | 25,26 | 4,85 | | B-VV/ 2019-283 | 12,7 | 240 | 12,53 | 1,38 |
8,83 | 50,92 | 0,72 | 5,13 | 16,58 | 22,00 | | B-VV/ 2019-284 | 12,9 | 125 | 2,78 | 0,96 | 4,86 | 39,29 | 0,32 | 2,00 | 7,25 | 6,25 | | B-VV/ 2019-285 | 13,1 |
102 | 1,37 | 1,66 | 3,86 | 27,64 | 0,26 | 1,61 | 6,48 | 3,20 | | B-VV/ 2019-303 | 13,3 | 99 | 1,48 | 1,27 | 3,15 | 19,90 | 0,24 | 1,26 | 5,84 | 2,72 |
| B-VV/ 2019-304 | 13,5 | 185 | 4,94 | 3,32 | 8,23 | 53,05 | 0,31 | 2,15 | 14,28 | 9,06 | | B-VV/ 2019-305 | 13,7 | 88 | 1,85 | 0,76 | 3,85 | 28,60 | 0,30 |
1,43 | 4,96 | 2,81 | | B-VV/ 2019-308 | 13,9 | 106 | 2,05 | 1,11 | 4,91 | 31,66 | 0,30 | 1,38 | 4,98 | 4,02 | | B-VV/ 2019-309 | 14,1 | 127 | 3,22 | 0,74 |
5,79 | 44,10 | 0,56 | 1,54 | 5,40 | 6,09 | | B-VV/ 2019-310 | 14,3 | 85 | 2,24 | 1,29 | 3,70 | 24,77 | 0,18 | 2,78 | 4,51 | 2,97 | | B-VV/ 2019-312 | 14,7 |
85 | 1,99 | 3,80 | 4,47 | 31,47 | 0,19 | 1,54 | 3,41 | 4,09 | | B-VV/ 2019-313 | 14,9 | 94 | 1,08 | 0,77 | 3,39 | 24,58 | 0,14 | 1,15 | 3,38 |
3,18 | | B-VV/ 2019-315 | 15,3 | 78 | 1,26 | 0,77 | 3,01 | 24,63 | 0,11 | 1,33 | 2,56 | 3,53 | | B-VV/ 2019-316 | 15,5 | 148 | 3,05 | 1,79 | 7,02 | 44,44 | 0,26 |
1,67 | 2,06 | 7,98 | | B-VV/ 2019-317 | 15,7 | 86 | 1,57 | 1,62 | 5,25 | 47,36 | 0,31 | 0,92 | 5,04 | 5,01 | | B-VV/ 2019-318 | 15,9 | 113 | 1,76 | 1,28 |
4,15 | 39,64 | 0,27 | 1,11 | 4,48 | 5,14 | | B-VV/ 2019-319 | 16,1 | 114 | 2,00 | 1,13 | 4,46 | 45,30 | 0,26 | 1,74 | 4,24 | 4,72 | | B-VV/ 2019-320 | 16,3 |
129 | 2,90 | 1,14 | 5,24 | 44,08 | 0,26 | 1,60 | 5,41 | 5,86 | | B-VV/ 2019-321 | 16,5 | 165 | 3,94 | 2,84 | 6,01 | 46,22 | 0,36 | 2,07 | 8,21 |
8,68 | | B-VV/ 2019-339 | 16,9 | 158 | 5,07 | 3,51 | 5,66 | 40,96 | 0,34 | 6,14 | 17,18 | 6,70 | | B-VV/ 2019-340 | 17,1 | 101 | 1,14 | 1,14 | 3,03 | 27,24 |
0,15 | 1,35 | 1,82 | 5,66 | | B-VV/ 2019-341 | 17,3 | 145 | 4,38 | 1,51 | 4,74 | 42,24 | 0,43 | 2,38 | 1,62 | 10,02 | | B-VV/ 2019-342 | 17,5 | 125 | 3,49 |
0,94 | 5,60 | 39,44 | 0,24 | 1,74 | 4,10 | 6,34 | | B-VV/ 2019-343 | 17,7 | 129 | 2,83 | 2,74 | 4,98 | 43,14 | 0,22 | 1,80 | 6,27 | 9,06 | | B-VV/ 2019-344 |
17,9 | 110 | 2,27 | 1,42 | 4,00 | 34,90 | 0,19 | 2,02 | 0,16 | 5,11 | | B-VV/ 2019-345 | 18,1 | 86 | 1,47 | 1,11 | 3,43 | 27,43 | 0,13 | 1,84 |
3,63 | 4,60 | | B-VV/ 2019-346 | 18,3 | 124 | 1,98 | 0,75 | 4,30 | 32,31 | 0,23 | 1,18 | 6,15 | 5,85 | | B-VV/ 2019-348 | 18,7 | 138 | 2,38 | 1,31 | 6,07 |
41,23 | 0,36 | 1,62 | 6,55 | 5,73 | | B-VV/ 2019-349 | 18,9 | 93 | 1,52 | 1,46 | 3,70 | 26,60 | 0,19 | 1,44 | 4,14 | 3,88 | | B-VV/ 2019-350 | 19,1 | 98 |
1,22 | 1,47 | 3,78 | 24,34 | 0,24 | 1,37 | 6,35 | 3,22 | | B-VV/ 2019-351 | 19,3 | 82 | 0,97 | 1,42 | 2,74 | 19,25 | 0,15 | 1,18 | 4,81 | 2,30 |
| B-VV/ 2019-353 | 19,7 | 85 | 2,03 | 2,28 | 5,57 | 37,09 | 0,30 | 1,92 | 5,70 | 4,27 | | B-VV/ 2019-354 | 19,9 | 122 | 2,49 | 1,55 | 6,25 | 43,37 | 0,30 |
1,95 | 6,80 | 4,78 | | B-VV/ 2019-355 | 20,1 | 89 | 1,20 | 1,32 | 3,63 | 22,94 | 0,22 | 1,26 | 5,85 | 2,22 | | B-VV/ 2019-356 | 20,3 | 107 | 1,30 | 1,52 |
3,95 | 27,77 | 0,30 | 1,40 | 4,92 | 2,70 | | B-VV/ 2019-357 | 20,5 | 37 | 1,14 | 2,71 | 4,27 | 26,00 | 0,20 | 1,60 | 5,82 | 2,64 | | B-VV/ 2019-358 | 20,7 |
118 | 1,25 | 3,63 | 4,53 | 24,47 | 0,19 | 1,50 | 8,28 | 3,16 | | B-VV/ 2019-366 | 20,9 | 105 | 1,33 | 1,43 | 4,19 | 28,05 | 0,28 | 1,23 | 4,64 |
3,03 | | B-VV/ 2019-368 | 21,3 | 99 | 1,33 | 1,46 | 4,55 | 29,95 | 0,21 | 1,32 | 4,62 | 4,91 | | B-VV/ 2019-369 | 21,5 | 73 | 1,73 | 1,97 | 3,42 | 18,25 |
0,17 | 1,14 | 6,30 | 1,94 | | B-VV/ 2019-370 | 21,7 | 73 | 1,04 | 2,25 | 4,34 | 20,11 | 0,17 | 1,37 | 6,40 | 2,98 | 
Fig. 9. Ionic composition of the Late Pleistocene re-vein ice IW-17, Batagai edoma Table 2. Ionic composition of Late Pleistocene re-vein ice IW-20, Batagai edoma | Field sample number |
Chapter, m | EU, msm | Na+, mg/l | K+, mg/l | Mg 2+, mg/l | Ca 2+, mg/l | F, mg/l | Cl-, mg/l | NO. 3-, mg/l | SO 4 2-, mg/l | | B-VV/ 2019-183 | 1,3 | 141 | 3,43 | 1,22 | 4,90 | 24,70 |
0,42 | 4,13 | 11,74 | 5,77 | | B-VV/ 2019-185 | 1,7 | 262 | 7,27 | 2,68 | 13,07 | 50,00 | 0,67 | 13,72 | 16,50 | 22,24 | | B-VV/ 2019-187 | 2,1 |
114 | 3,40 | 1,26 | 3,32 | 20,54 | 0,32 | 2,03 | 8,30 | 4,47 | | B-VV/ 2019-189 | 2,5 | 93 | 2,78 | 1,27 | 3,61 | 13,00 | 0,21 |
1,71 | 8,01 | 2,95 | | B-VV/ 2019-191 | 2,9 | 121 | 4,11 | 2,64 | 4,41 | 25,46 | 0,31 | 3,25 | 10,82 | 4,23 | | B-VV/ 2019-193 | 3,3 |
103 | 2,71 | 2,50 | 4,01 | 17,00 | 0,29 | 2,01 | 8,96 | 2,57 | | B-VV/ 2019-195 | 3,7 | 104 | 2,50 | 1,24 | 4,27 | 23,22 | 0,27 |
1,75 | 7,96 | 2,47 | | B-VV/ 2019-197 | 4,1 | 111 | 2,75 | 1,70 | 4,88 | 30,20 | 0,36 | 1,71 | 7,33 | 3,45 | | B-VV/ 2019-199 | 4,5 |
118 | 2,82 | 1,62 | 5,55 | 36,80 | 0,35 | 1,95 | 7,98 | 3,10 | | B-VV/ 2019-203 | 5,3 | 159 | 4,40 | 1,25 | 8,06 | 47,20 | 0,67 |
2,86 | 8,88 | 5,48 | | B-VV/ 2019-205 | 5,7 | 252 | 2,11 | 2,16 | 3,40 | 16,27 | 0,26 | 2,17 | 6,85 | 3,74 | | B-VV/ 2019-207 | 6,1 |
100 | 2,58 | 1,10 | 3,71 | 17,68 | 0,29 | 2,60 | 6,51 | 3,40 | | B-VV/ 2019-209 | 6,5 | 89 | 1,67 | 1,13 | 3,25 | 16,07 | 0,15 |
1,44 | 6,47 | 2,07 | | B-VV/ 2019-211 | 6,9 | 101 | 2,50 | 1,56 | 3,19 | 16,95 | 0,22 | 1,72 | 8,65 | 2,61 | | B-VV/ 2019-213 | 7,3 |
117 | 2,02 | 1,36 | 4,05 | 22,35 | 0,16 | 1,64 | 13,35 | 3,53 | | B-VV/ 2019-215 | 7,7 | 109 | 1,63 | 1,65 | 3,16 | 19,05 | 0,18 | 1,65 |
8,83 | 3,70 | | B-VV/ 2019-217 | 8,1 | 109 | 1,60 | 2,28 | 3,90 | 23,80 | 0,18 | 2,80 | 13,17 | 3,00 | | B-VV/ 2019-219 | 8,5 | 110 |
2,00 | 1,50 | 3,90 | 17,40 | 0,24 | 1,18 | 4,85 | 2,48 | | B-VV/ 2019-221 | 8,9 | 85 | 1,80 | 1,00 | 3,22 | 16,60 | 0,11 | 2,19 |
3,68 | 3,82 | | B-VV/ 2019-222 | 9,1 | 94 | 1,53 | 1,00 | 3,38 | 18,48 | 0,13 | 1,44 | 5,03 | 2,83 | 
Fig. 10. Ionic composition of the Late Pleistocene re-vein ice IW-20, Batagai edoma Discussion The macronutrient composition of re-vein ice is formed by the combined influence of the ionic composition of the waters that formed these ices and the macrocomponent composition of the sediments containing the ice. The macronutrient composition can be used as an indicator of the change in geochemical conditions of migration-the accumulation of chemical elements occurring as a result of a change in the landscape conditions of ice formation. Thus, the sodium chloride composition reports the effect of marine aerosols on the salinization of re-vein ice, a decrease in Cl-Na salinization of underground ice indicates an almost complete loss of connection of these ices with the sea. The ions Ca 2+ and SO 4 2- may indicate the effect of the ice-containing soils on the chemical composition of the ice. Under continental conditions, macronutrients in the composition of re-vein ice also indicate a change in ice formation conditions from slightly alkaline gley to acidic gley in the Holocene. The total mineralization of the North Yakut ice is extremely low (up to 90 mg/l), however, salinity anomalies occur (from less than 30 mg/l to 400-430 mg/l).[16]
More than half of the samples from the veins of Chukotka have a mineralization of less than 0.05 g/l (Fig. 12, a), whereas veins with such mineralization in Western Siberia were found only in 16%, and in the North of Yakutia – in 147 cases. But if we take a wider range – less than 0.15 g/l, then the similarity is closer – in Chukotka This is almost 100% of all analyzed samples, in Western Siberia – 89%, and in the north of Yakutia – 80%. These data suggest that although there are regional differences in the composition of salts in the polygonal vein strata of various regions of the Eurasian cryolithozone (caused primarily by the unequal nature of air mass transfer in winter and different influences near the oceans), their similarity is much more pronounced, which manifests itself in low mineralization and the dominance of hydrocarbonates, which Most likely, it indicates the atmospheric nature of the water, which mainly fed the veins in the Late Pleistocene, as well as later - in the Holocene and at the present time. Re-vein ice in other fragments of the Batagai edoma. Earlier, we considered the ionic composition of re-vein ices and their host deposits in other fragments of the Batagai edoma (mainly in veins No. 1-7). The mineralization of Late Pleistocene vein ice ranged from 66.56 to 424.8 mg/l, from ultra-fresh to desalinated, the ionic composition of the ice is bicarbonate-calcium and corresponds to snow formed under the influence of continental salts.[17-19] A large variation in the content of Na, Mg, Al, Ca, Fe in ground inclusions in ice indicates a change in the geochemical environment of ice formation. Edom strata of Northern Yakutia. The mineralization of Late Pleistocene veins in the sedimentary strata of Northern Yakutia is diverse. The total range in the dry residue content is 60-478 mg/l. The average content of water-soluble salts in edoms located on and far from the coast varies. Thus, in the edom of the Bykovsky Peninsula, the average dry residue content exceeds 200 mg/l, and in no sample was its value less than 140 mg /l noted, and in the strata of the "inner" edom mineralization is noticeably less – they are all fresh: the edom of the Plakhinsky Yar – 110 mg /l, Duvan Yar – 120 mg/l, Cape Verde – 110 mg/l, Ust-Omolonsky Yar – 130 mg/l, lower Omolon – 120 mg/l. The mineralization of the edom of the interfluves is even less – the ice lived here is more often ultra-fresh: in the Kulara basin, on average 70 mg/ l, in the center of the Omolono–Anyuyskaya edom (upper Timkinskaya River) - 50-60 mg/ l (in each of the above-mentioned edom sections, from 30 to 50 samples of vein ice were analyzed). A distinctive feature of all syngenetic veins in edoms is the dominance of hydrocarbonates, which often make up more than half of the total salt content, and This is typical for both more and less mineralized ices. Of the other components, calcium attracts attention, in many cases exceeding 25% of the total salt content; sulfates are noticeable in the thicknesses of the edom from the interior of the interfluves, the content of which often reaches 25%. These data are supplemented by information systematized earlier in 1979 by O. V. Grinenko with colleagues and in 1981 by A. A. Archangelov with employees (oral reports) on the mineralization of re-vein ice in sections located in the lower reaches of the Kolyma River, according to which strata in which re-vein ice in edom strata have a mineralization of less than 100 m/l, these include the Stanchikovsky Yar section, most of the sections located in the middle reaches of the Chukochya River and near the Mavrinskoye and Yakutskoye lakes, the main part of the Molotkovsky Stone complex and the outcrop in the valley of the Alazei River and those in which veins are characterized by mineralization from 100 to 200 mg/l, reaching in some horizons 250-400 mg/l. These include ice Antokhinsky Yar, outcrops at the mouth of the Chukochya river, Krestovka river. Particularly high mineralization values were noted in the lower parts of the outcrops. In wells drilled under the edge of Lake Yakutskoye and under the edge of the Chukochya River near the mouth, medium–saline vein ice was found, their mineralization here reaches 2400-3400 mg/ l. The value of 3073 mg/ l was noted in the lower part of the buried ice vein of the Marine outcrop at the mouth of the Chukochya River: 1330 mg/l and 514 mg/l - in the buried ice vein a vein at the mouth of the Krestovka river. In almost all cases, salinity is of the sodium chloride and sodium chloride-bicarbonate type, except for vein ice with a mineralization of 1330 mg/l, where the salinity is sulfate-bicarbonate. In the primorsky part, there are the results of research by K. A. Kondratieva et al.[20] He lived in the outcrop of Mushai in the lower reaches of the Yana. The dry residue in the veins is 60-160 mg/l (and only in one of the samples from the middle part of the section – up to 400 mg/l). The results of the work of V. P. Volkova and N. N. Romanovsky in the Uyaninsky depression[2] and in the southern part of the Yano-Indigirskaya lowland[3] showed that the chemical composition of Late Pleistocene re-vein ice is quite homogeneous here: the mineralization of veins in the alluvium of the Uyandinsky depression ranges from 30 to 100 mg/l; ice has always lived bicarbonate. The same ultra–fresh ice in Chromium alluvium has a mineralization from 20 to 100 mg/l. According to V. P. Volkova and N. N. Romanovsky [2,3], the results of their analysis of the chemical composition of re-vein ice show that surface waters with lower mineralization and more uniform composition than the waters of the seasonal thawing layer participate in the formation of veins. Fresh and ultra–fresh veins lying in the strata of the Lena alluvial terraces were studied by N. P. Anisimova[4] - here the mineralization of veins varies from 28 to 90 mg/l, salinity is also predominantly bicarbonate. A slightly higher concentration of salts is sometimes observed here in the upper fused parts of veins. N. P. Anisimova associates this with the migration of easily soluble salts from the seasonally shallow layer, the mineralization of individual parts of which can noticeably increase during freezing. According to her research, the layer that is frozen last becomes more saline, and the content of bicarbonate and sodium ions increases to a greater extent[4]. One can imagine a situation where cracking occurs with incomplete freezing of the seasonally thawed layer and when highly mineralized water from an unfrozen lens can get into a frost-breaking crack and, consequently, into the underlying ice vein. Such a process is extremely rare, Occurring only in exceptional cases, as indicated by the extremely rare occurrence of highly mineralized re-vein ice.
As a percentage of the total number of analyzed vein ice samples from edom, the occurrence of medium-saline ice is negligible,[6] however, they cannot be ignored, since such samples may indicate the possibility of subaqueous formation of ice veins in the Late Pleistocene under shallow sea (we emphasize, rarely, but still likely). Of course, in some cases, such as in the lower part of the coastal marine outcrop near the mouth of the Chukochya River, increased mineralization could be explained by the leakage of seawater already in the process of modern thermoabrasion opening of veins, and in other cases by the migration of salts into veins from the host sediments. However, there are counterarguments to this: A. N. Tolstov[1] cites data from P. F. Shvetsov, who discovered ice with sodium chloride salinity in the outcrop of Ovalnoye Lake, located in the north of the Yano-Indigirskaya lowland 120 km from the sea, with a dry residue content of 2910 mg/l. This sample turned out to be a single one. During repeated testing of veins in this area, mineralization values of 60-160 mg/L. A. N. Tolstov[1] explains the presence of highly mineralized vein ice by wind transport of salts from the seashore. Significant postgenetic salinization of veins by salts migrating from the host frozen strata is unlikely. In almost all cases when highly mineralized vein ice was encountered, the deposits containing them did not differ in abnormally high mineralization of it, and vice versa, where the dry residue in the aqueous extract from the host strata exceeded 0.2–0.4%, vein ice with a mineralization not exceeding 200 mg/l was deposited. There is evidence that the transfer of sea salts by atmospheric precipitation is possible over a distance of 1000-4000 km, and it is interesting that even near sea coasts chlorine does not always prevail in them (although its content is often up to half of the total amount of salts), the participation of other components is often noticeable. We tend to believe that the increased mineralization in each case is due to various reasons. If the veins at the mouth of the Chukochya River and on the shore of Ovalnoye Lake (as well as the vein ice of Bely Island and Yavai Peninsula previously described by the author[6,21] in their individual parts are strongly mineralized due to the participation of seawater (preserved in some lakes after strong tides), flowing through cracks into the body of veins during their formation, then the veins in the Krestovka outcrops (as well as the veins of Mammoth Mountain and Lena terraces), having a continental type of salinity, are highly mineralized, apparently mainly due to the leakage of stagnant swamp waters through cracks into the vein ice. A comparison of the chemical composition of Holocene and Late Pleistocene veins of Northern Yakutia[6] indicates their difference, manifested primarily in the frequent occurrence of more mineralized veins of Late Pleistocene age (for example, ice with a mineralization of 0.05–0.15 g/l is found in them in 68% of cases, and in Holocene – in 47%), However the main type of salinization of underground ice cannot be attributed in any way not only to the sea, but even rarely to the desalinated lagoon. The dominance of carbonates in edom veins probably indicates colder conditions of their formation. At the same time, the meteoric nature of the vast majority of the water that fed the veins is beyond doubt. Edomous strata of the north of Western and Central Siberia. The polygonal vein ice near Marre Sale is ultra-fresh and fresh (21-88 mg/l), has a bicarbonate-chloride, chloride, and sodium composition.[22] In the area of P. Dickson, in the PLL studied on the slope of a valley 7 m above sea level, Ca 2+ and HCO 3- ions predominate, the source of which were continental aerosols; Cl- and Na+ ions, which came from seawater during flooding of lowlands, predominate in veins opened in the bottom of the valley.[23] The mineralization of these veins is about 50 mg/l.[24] The ice of the veins of the lower and upper tiers on Sibiryakova Island, located in the waters of the Yenisei Bay, has a low mineralization – about 40 mg/ l; Cl- and Na+ predominate. The chemical composition of the veins of both tiers is similar to the veins of the Dixon section located in the bottom of the valley), i.e. they were also influenced by sea waters. However, the ice of the upper tier veins differs from the ice of the lower tier veins by an increased content of organic matter and NH 4+, V, Fe, Zn, Mo, Cd, Sn, which indicates the presence of a geochemical reduction barrier during peat accumulation.[24] The areas occupied by polygonal vein ice, uncovered in the Karepovsky section, at the mouth of the river. The Yenisei is small. Ice melts with a mineralization of about 90 mg/l are characterized by a chloride-calcium-magnesium composition. The ratio of basic ions and the enrichment of ice B, Br, I and Ba indicate the participation of marine aerosols in their formation in a closed thermokarst basin.[24]
The re-vein ice of North America. K. Campbell-Heaton[10,11] made sure that the molar ratio of the main ions (Ca 2+, Mg 2+, Na+ and SO 4 2-) confirms that snowmelt is the main source of dissolved substances in ice veins. Snow cover studies on the Fosheim Peninsula and Axel-Heiberg Island have shown that the chemical composition of snowmelt is very similar to the chemical composition of snow cover and that Ca 2+ and Mg 2+ predominate in the initial snow cover. The ratios of Ca 2+/Cl-, Mg 2+/Cl-, Na+/Cl- in ice veins are similar to the snow sample and lower than in the active layer, and in some cases significantly lower. However, in the ice veins on the shore of the Mocha Fjord, the Na+/Cl ratio is higher than in the active layer. Most of the re-vein ice samples have a Na+/Cl-ratio close to that at sea level. The ratio of SO 4 2-/Cl- in most ice veins is higher than in samples of both snow and seasonally thawed layer. In general, the molar ratios of the main ions (Ca 2+/Cl-, Mg 2+/Cl-, Na+/Cl-) are more similar to snow than to the leached active layer, which suggests that the ice veins are filled mainly with melted snow water with a negligible contribution of leached surface organics. This conclusion is consistent with the data of J. Battle and K. Fraser[25], who used similar molar ratios during the spring thaw of 1990 in a small swampy basin on Axel Heiberg Island, and found that meltwater runoff is especially actively enriched with calcium, magnesium and sodium when meltwater comes into contact with soil. The difference in the ratio of SO 4 2-/Cl- in ice veins compared to samples of snow and the active layer is probably due to the strong presence of marine aerosols during the formation of these veins.[10] K.Holland and co-authors[13] suggested that since, as is known, ice veins are fed mainly by meltwater from winter snow cover, their geochemistry can preserve the composition of impurities of the initial snow. And, although ice veins may be exposed to other sources of pollution from the earth's surface and surrounding precipitation, re-vein ice in coastal regions, where ion concentrations in the snow cover are mainly determined by the deposition of sea salt, may have great potential as an archive of marine aerosol. In their study of Holocene re-vein ice, ionic geochemistry of coastal ice veins in combination with isotopic composition was used to study the possibility of preserving marine aerosols in re-vein ice of Pleistocene age. This study[13] showed that marine aerosols are well preserved, and a marine signal can be isolated in the ion-geochemical record. However, ice veins undergo significant changes occurring on the surface of the earth and in the seasonally thawed layer during the filling of frost-breaking cracks, during the melting of snow, which potentially washes out annually accumulated sea salt on the surface of the tundra, as well as minerals originating from the soil. K. Holland and co-authors[13] investigated the ion-geochemical record in an ice vein on the coast of the Beaufort Sea near Taktoyaktak. They investigated the marine and lithogenic origin of ions characteristic of the main components of sea salt. The research site was located on a polygonal vein array on the coast of Taktoyaktak (69.409 ° s.w., 133.124° s.d.). The ice vein studied in detail was located approximately 70 meters from the coastline. The calibrated radiocarbon age of dissolved organic carbon extracted directly from ice veins indicates a slow growth of re-vein ice from 4,700 to 1,600 years ago, followed by rapid growth up to 640 years ago. According to K.Holland and co-authors[12,13] 118 samples from ice veins with concentrations of Cl- and Na+ are the highest, which is expected due to marine influence, while Cl- (from 3.65 to 26.64 mg/l, on average 9.63 mg/l) has an average higher concentration than Na+ (from 1.99 to 13.39 mg/l, an average of 5.29 mg/l). In descending order are: Mg 2+, Ca 2+ and K+ (respectively, on average 1.14, 0.83 and 0.63 mg/l). The ion concentrations in the Holocene ice vein demonstrated remarkable similarity of values with similar ions in the snow cover. The average ratios calculated as the arithmetic mean of the ratios in the sample are 1.80 for Cl-/Na+, 0.005 for Br/Na+, 0.13 for SO 4 2-/Na+, 0.25 for Mg 2+/Na+, 0.17 for Ca 2+/Na+ and 0.15 for K+/Na+.[12,13] It is important to note that the data recently obtained by Korean researchers[26, suppl. table S2] on the ionic composition of ice veins in the Batagai edoma correspond well with those given in this article: the content of chlorine anions mainly varies from 2 to 6 mg/l (and in single samples reaching 22 mg/l; the average concentration of anions sulfates are 1-2 mg/l. (in one of the samples 5 mg/l); the content of calcium cations is 10-15 mg / l (rarely reaching 49-50 mg/l); the concentration of potassium cations is 3-7 mg/ l (sometimes reaching 19-21 mg /l).[26, suppl. table S2] Conclusions 1. The two adjacent ice veins studied in the Batagai edom belong to ultra-fresh ice with a concentration of basic ions from 20 to 40 mg/l.
2. The ionic composition of the IW-17 re-vein ice is noticeably dominated by sodium and calcium cations, reaching 24.15 and 53.16 mg/l in one of the samples, respectively. In the same sample, chlorine anions reach 34.51 mg/l. The average concentration of sulfate anions is 2-3 mg/l.
3. The ionic composition of the IW-20 re-vein ice is noticeably dominated by sodium and calcium cations, reaching 7.27 and 50.0 mg/l, respectively, in one of the samples. In the same sample, chlorine anions reach 13.72 mg/l. The average concentration of sulfate anions is 2-4 mg/l, reaching 22.24 mg/l. 4. The content of calcium cations is 6-20 mg/l (rarely reaching 42-53 mg/l); 5. The concentration of potassium cations is 0.7-3 mg/l. 6. The presence of nitrate anions in the composition of IW-17 is noticeable, amounting mainly to 4-7 mg/l at the extreme of NO 3-reaches 16 and even 26 mg/l at a depth of 12.5 m. In the composition of IW-20, nitrate anions are mainly 6-8 mg/l and reach a depth of 7-8 m - 13 mg/l. Thanks The author is grateful to L.B. Bludushkina, N.A. Budantseva, A.P. Ginzburg, L.V. Dobryneva, E.S. Slyshkina and A.Y. Trishin for their help in field and laboratory research and in the design of the work.
References
1. Tolstov, A.N. (1964). Cases of the presence of ice wedge in the tundra in chemical composition close to sea water. In Problems of paleogeography and morphogenesis in polar countries and highlands, pp. 182-184. Moscow: Moscow University Press.
2. Volkova, V.P., & Romanovsky, N.N. (1970). Some features of the chemical composition of underground ice in the Uyanda depression and adjacent parts of the Selennyakh ridge. In Permafrost Research.Vol. 10, pp. 114-128. Moscow: Moscow University Press.
3. Volkova, V.P., Romanovsky, N.N. (1974). On the chemical composition of underground ice in Quaternary deposits of the southern part of the Yana-Indigirka Lowland. In Problems of cryolithology. Vol. 4, pp. 199-208. Moscow: Moscow University Press.
4. Anisimova, N.P. (1981). Cryohydrogeochemical features of the frozen zone. Novosibirsk: Nauka.
5. Vasil'chuk, Yu.K., & Trofimov, V.T. (1983). Cryohydrochemical peculiarities of ice–wedge complexes in the north of Western Siberia. In Permafrost. Fourth International Conference, Proceedings, pp. 1303-1308. Fairbanks. Alaska. National Academy Press. Washington.
6. Vasil'chuk, Yu. K. (1992). Oxygen isotope composition of ground ice (application to paleogeocryological reconstructions). Volume 1, 420 pp. Volume 2, 264 pp. Theoretical Problems Department, Russian Academy of Sciences and Lomonosov Moscow University Publications, Moscow).
7. Savoskul, O.S. (1995). Ion content of polygonal wedge ice on Bolshoi Lyakhov: a source of palaeoenvironmental information. Ann Glaciol, 21, 394-398. doi:10.1017/s026030550001612827
8. Kotov, A.N., & Brazhnik, S.N. (1991). Chemical composition of ice wedges in Chukotka. In Complex geocryological studies of Chukotka. Magadan: SVK Research Institute, pp. 39-48.
9. Lakhtina, O.V. (1978). Physical and chemical properties of soils in the Kolyma Lowland. In Proceedings of PNIIIS.Vol. 54, pp. 13-54. Moscow: Stroyizdat.
10. Campbell-Heaton, K. (2020). Ice wedge activity in the Eureka Sound Lowlands, Canadian High Arctic. A thesis submitted to the University of Ottawa in partial fulfillment of the requirements for the Master of Science in Geography. Department of Geography, Environment and Geomatics. Faculty of Arts. CryoLab for Arctic, Antarctic and Planetary Studies (CLAAPS). University of Ottawa.
11. Campbell-Heaton, K., Lacelle, D., Fisher, D., & Pollard, W. (2021). Holocene ice wedge formation in the Eureka Sound Lowlands, high Arctic Canada. Quaternary Research. Vol. 102, 175-187. doi:10.1017/qua.2020.126
12. Holland, K.M. (2020). Ice-Wedge Archives in the Northwestern Canadian Arctic. A thesis submitted in conformity with the requirements for the degree of Master of Science. Department of Geography and Planning. University of Toronto.
13. Holland, K.M., Porter, T.J., Criscitiello, A.S., Froese, D.G. (2023). Ion geochemistry of a coastal ice wedge in Northwestern Canada: Contributions from marine aerosols and implications for ice-wedge paleoclimate interpretations. Permafrost and Periglacial Processes, 34(2), 180-193. doi:10.1002/ppp.2184
14. Vasil'chuk, Yu.K., Vasil'chuk, A.C., Budantseva, N. A., Vasil'chuk, J.Yu., & Ginzburg, A.P. (2024). Synchronous isotopic curves in Ice Wedges of the Batagay Yedoma: Precision Matching and Similarity Scoring. Permafrost and Periglacial Processes. doi:10.1002/ppp.2243
15. Vasil'chuk, Yu K., Vasil'chuk, J.Yu, Budantseva, N.A., & Vasil'chuk, A.C. (2022). MIS 3-2 paleo-winter temperature reconstructions obtained from stable water isotope records of radiocarbon-dated ice wedges of the Batagay Ice Complex (Yana Upland, eastern Siberia). Radiocarbon, 64(6), 1403-1417. doi:10.1017/RDC.2022.60
16. Vasil’chuk, Yu.K. (2016). Geochemical composition of ground ice in the Russian Arctic. Arctic and Antarctic, 2, 99-115.
17. Vasilchuk, Yu.K., Vasilchuk, J.Yu., Budantseva, N.A., Vasilchuk, A.C., & Trishin, A.Yu. (2017). Isotope-geochemical features of the Batagay Yedoma (preliminary results). Arctic and Antarctic, 3, 69-98.
18. Vasilchuk, Yu.K., Vasilchuk, J.Yu., Budantseva, N.A., Vasilchuk, A.C., & Ginzburg, A.P. (2021). Geochemical composition of ice wedges in the Batagay yedoma. Arctic and Antarctic, 2, 99-115.
19. Vasil’chuk, Yu.K., Vasil’chuk, J.Yu., Budantseva, N.A., Vasil’chuk, A.C., Belik, A.D., Bludushkina, L.B., Ginzburg, A.P., Krechetov, P.P., & Terskaya, E.V. (2020). Major and trace elements, δ13C, and polycyclic aromatic hydrocarbons in the Late Pleistocene ice wedges: A case-study of Batagay yedoma, Central Yakutia. Applied Geochemistry, 120, 104669. doi:10.1016/j.apgeochem.2020.104669
20. Kondratyeva, K.A., Trush, N.I., Chizhova, N.I., Rybakova, N.O. (1976). On the characteristics of Pleistocene deposits in the Mus-Khaya outcrop on the Yana River. In Permafrost Research, 15, 60-93. Moscow: Moscow University Press.
21. Vasil'chuk, A.C. & Vasil'chuk, Yu.K. (2015). Engineering-geological and geochemical conditions of polygonal landscapes on the Belyy Island (the Kara Sea). Engineering Geology, 1, 50-65.
22. Butakov, V.I., Slagoda, E.A., Opokina, O.L., Tomberg, I.V., & Zhuchenko, N.A. (2020). The formation features of the hydrochemical and trace element composition of various types of ground ice at Marre-Sale Cape. Kriosfera Zemli (Earth's Cryosphere), XXIV(5), 29-44. doi:10.21782/EC2541-9994-2020-5(23-37)
23. Butakov, V.I. (2022). Features of the formation of the geochemical composition of ground ice in the Kara region. Abstract of the dissertation for the scientific degree of candidate of geological and mineralogical sciences. Tyumen.
24. Opokina, O.L., Slagoda, E.A., Tomberg, I.V., Suslova, M.Y., Firsova, A.D., Khodzher, T.V., & Zhuchenko, N.A. (2014). Sea level fluctuations and their signature in the composition and structure of polygonal wedge ice in the Yenisei River lower reaches. Ice and Snow, 54(2), 82-90. doi:10.15356/2076-6734-2014-2-82-90
25. Buttle, J. M., & Fraser, K. E. (1992). Hydrochemical fluxes in a high arctic wetland basin during spring snowmelt. Arctic & Alpine Research, 24(2), 153-164. doi:10.2307/1551535
26. Park, Р., Ko, N.-Y., Kim, J.E., Opel, T., Meyer, H., Wetterich, S., Fedorov, A., Shepelev, A.G., Jung, H., & Ahn, J. (2024). A Biogeochemical Study of Greenhouse Gas Formation From Two Ice Complexes of Batagay Megaslump, East Siberia. Permafrost and Periglacial Processes. doi:10.1002/ppp.2234
Peer Review
Peer reviewers' evaluations remain confidential and are not disclosed to the public. Only external reviews, authorized for publication by the article's author(s), are made public. Typically, these final reviews are conducted after the manuscript's revision. Adhering to our double-blind review policy, the reviewer's identity is kept confidential.
The list of publisher reviewers can be found here.
The subject of the study is the study of the ionic composition of the re-vein ice of the Batagai edoma for comparison with the Late Pleistocene re-vein ice of other edomas and some Holocene strata. The research methodology consisted in parallel simultaneous sampling of re-vein ice from two neighboring ice veins IW-17 (left) and IW-20 (right) of the Batagai edom strata, followed by analysis of the ice texture and isotopic radiocarbon analysis. Ice samples were taken from ice veins vertically every 10 cm, then using Makita DDF481rte 18B and Bosch GSR 36 VE-2-LI drills with steel ice crowns with a diameter of 51 mm, and selection was also performed in a number of horizontal profiles. Measurements of the macrocomponent composition of the ice were carried out using the ion chromatograph "Steyer", the detection limit for chloride ion is 0.02 mg/l. which is intended for qualitative and quantitative determinations of inorganic compounds in aqueous solutions of various origins. For samples from recycled ice, a method was used to measure the mass concentration of cations in samples of drinking, mineral, natural and waste water by ion chromatography FR.1.31.2005.01738. The range of detectable concentrations is 0.10-20.00 mg/dm3, and for the determination of anions, a method was used to measure the mass concentration of Cl-, SO42-, NO3- in samples of drinking, mineral, natural and wastewater by ion chromatography FR.1.31.2005.01724, The relevance of the study is to study the chemical ionic composition syncreogenic underground ice of the Batagai edoma, which reflects the peculiarities of the hydrochemical situation at the time of their formation and serves as a reliable criterion for paleogeocryological constructions. The article, having scientific significance, can also perform a great practical useful service, since it has great and applied methodological significance and will be useful to students and graduate students. The scientific result consists in the study of two adjacent ice veins in the Batagai edom, belonging to ultra-fresh ice with a concentration of basic ions from 20 to 40 mg/l. Sodium and calcium cations significantly predominate in the ionic composition of IW-17 re-vein ice, reaching 24.15 and 53.16 mg/l in one of the samples, respectively. In the same sample, chlorine anions reach 34.51 mg/l. The average concentration of sulfate anions is 2-3 mg/l. The practical significance is determined by the improvement of existing or the development of new data, which will allow a more reasonable approach to assessing the future thermal state of saline frozen rocks. The obtained data can be applied in practice at the objects of assessment of thermidynamic processes. Style, structure, content The style of presentation is good, does not require editing, shortening. Photos, diagram, table are acceptable. The author of the article uses numerous illustrations in the form of photographs, graphics, tables to reflect scientific dependencies. The bibliography is extensive and exhaustive. An adequate modern list of references has been used. There are references to literary sources in the text. The appeal to the opponents consists in references to the literary sources used. Conclusions, the interest of the readership is undeniable. The conclusions are sufficiently reasoned, substantiated, and exhaustive. It can be useful for practitioners to implement, as well as students and graduate students.
|

 Eng
Eng