|
Arctic and Antarctica
Reference:
Vasil'chuk, Y.K., Ginzburg, A.P., Tokarev, I.V., Budantseva, N.A., Vasil'chuk, A.C., Palamarchuk, V.A., Vasil'chuk, J.Y., Bludushkina, L.B., Slyshkina, E.S. (2024). Stable isotopes of oxygen and hydrogen in frost blisters of the Chara River valley, Transbaikalia. Arctic and Antarctica, 2, 90–129. . https://doi.org/10.7256/2453-8922.2024.2.70706
Stable isotopes of oxygen and hydrogen in frost blisters of the Chara River valley, Transbaikalia
Vasil'chuk Yurii Kirillovich
ORCID: 0000-0001-5847-5568
Doctor of Geology and Mineralogy
Professor, Lomonosov Moscow State University, Faculty of Geography, Department of Landscape Geochemistry and Soil Geography
119991, Russia, Moscow, Leninskie Gory str., 1, office 2009

|
vasilch_geo@mail.ru
|
|
 |
Other publications by this author
|
|
Ginzburg Alexander Pavlovich
Junior Researcher, Scientific Center for Arctic Studies; Postgraduate student, Institute of Physicochemical and Biological Problems of Soil Science of the Russian Academy of Sciences
629007, Russia, Salekhard, Republic str., 20
|
|
alexandrginzburg13154@yandex.ru
|
|
 |
Other publications by this author
|
|
Tokarev Igor' Vladimirovich
PhD in Geology and Mineralogy
Leading Specialist, Resource Center "X-ray Diffraction Research Methods" of the Science Park of St. Petersburg State University
199034, Russia, Saint Petersburg, Universitetskaya str., 7
|
|
tokarevigor@gmail.com
|
|
 |
Other publications by this author
|
|
Budantseva Nadine Arkad'evna
PhD in Geography
Senior Scientific Associate, Lomonosov Moscow State University, Department of Landscape Geochemistry and Soil Geography
119991, Russia, Moscow, Leninsky Gory str., 1, office 2007
|
|
nadin.budanceva@mail.ru
|
|
 |
Other publications by this author
|
|
Vasil'chuk Alla Constantinovna
ORCID: 0000-0003-1921-030X
Doctor of Geography
Leading Scientific Associate, Lomonosov Moscow State University, Laboratory of Geoecology of the North
119991, Russia, Moscow, Leninskie Gory str., 1, office 10
|
|
alla-vasilch@yandex.ru
|
|
 |
Other publications by this author
|
|
Palamarchuk Valentina Anatol'evna
Junior Researcher, Scientific Center for Arctic Studies and Institute of the Earth's Cryosphere of the Tyumen Scientific Center SB RAS
629007, Russia, Salekhard, Republic str., 20
|
|
VAPalamarchuk@yanao.ru
|
|
 |
Other publications by this author
|
|
Vasil'chuk Jessica Yur'evna
Junior Scientific Associate, Lomonosov Moscow State University, Department of Landscape Geochemistry and Soil Geography
119991, Russia, Moscow, Leninsky Gory str., 1, office 2007
|
|
jessica.vasilchuk@gmail.com
|
|
 |
Other publications by this author
|
|
Bludushkina Lyubov' Bakhtiyarovna
Junior Scientific Associate, Lomonosov Moscow State University, Laboratory of Geoecology of the North
119991, Russia, Moscow, Leninsky Gory str., 1, office 2007
|
|
bludushkina19@mail.ru
|
|
 |
Other publications by this author
|
|
|
Slyshkina Elena Sergeevna
Junior Researcher, Lomonosov Moscow State University, Laboratory of Geoecology of the North
119991, Russia, Moscow, Leninskie Gory str., 1, office 10
|
|
lena.slyshkina@gmail.com
|
|
 |
Other publications by this author
|
|
|
DOI: 10.7256/2453-8922.2024.2.70706
EDN: VQZHAS
Received:
11-05-2024
Published:
12-07-2024
Abstract:
The study's focus is on the distribution of oxygen and hydrogen isotopes in the ice cores of frost blisters in the Chara River valley, Transbaikalia. The Kodar and Udokan mountain ranges surround the Chara Depression. Cryogenic (frosty) heaving is common in high humidity areas with loamy, clay, and peaty sediments. In summer 2023, the authors described two seasonal frost blisters in swampy, forested depressions on the periphery of the Charsky Sands (in the so-called thermosuffusion funnels). Oxygen and hydrogen isotopic compositions of oxygen (δ18O) and hydrogen (δ2H) in blister ice were analyzed. It has been established that seasonal frost blisters are formed mainly due to downward freezing of the water-saturated active layer sediments, but in some cases, ice was formed as well due to upward freezing from the lower boundary of the active layer. The vertical distribution of the isotope values, as well as the δ2H-δ18O ratio in ice, indicates a relatively rapid freezing of water in closed system conditions during one cycle of freezing. In the ice layers sampled horizontally, very similar isotopic composition values were obtained (for example, in blister ice 1, δ18О values ranged from –17.51 to –17.32‰), which indicates consistent horizontal freezing of ice layers. The slopes of the δ2H-δ18О ratio lines for blister ice are 5.82 (blister ice 1) and 5.95 (blister ice 2). A decrease of the δ2H and δ18О values of blister ice on frost mounds with depth and a slope of the δ2H-δ18O ratio line less than 8–7.3 indicates water freezing under closed system conditions during one cycle without moisture inflow. The distribution of isotopic values in the blister ice of seasonal frost mound 2 may indicate simultaneous bilateral freezing of the water volume.
Keywords:
permafrost, seasonal frost mounds, blister ice, oxygen isotope, hydrogen isotope, segregated blister ice, injected blister ice, seasonal active layer, Chara basin, Northern Transbaikalia
This article is automatically translated.
You can find original text of the article here.
Introduction Cryogenic heaving of soils, expressed in an increase in the volume of soil due to the freezing of gravitational moisture contained in it, can cause significant damage to linear and areal structures.[1,2] The intensity of cryogenic processes and the dynamics of the properties of permafrost landforms are closely related to climatic conditions. Determining the patterns of dynamics of the properties of cryogenic processes and phenomena, as well as establishing the nature of its connection with climatic changes at the present stage is one of the priority geocryological tasks[3]). The cryolithozone of the northern Transbaikalia has undergone a significant transformation over the past 60 years under the influence of climate change. Thus, there was a shift in the southern boundaries of the MMP distribution areas and the continuous spread of MMP by several hundred km to the north.[4] This led to the activation of numerous exogenous geological processes associated with the extraction of MMP ice – the flow of stone glaciers, waterlogging, thermokarst and thermal erosion.[4,5] In Transbaikalia, seasonal heaving mounds are most widely developed in the bottoms of falls and valleys of flowing tributaries in loamy, moist, stagnant soils. In addition, they are found on swampy and mossy areas of terraces, as well as on the gentle slopes of watersheds. The main source of nutrition for seasonal mounds are above-frozen waters.[6] E.A.Vtyurina[7] noted that the deep summer thawing of the soils of the area is favorable for seasonal heaving, while perennial mounds are rare here. Seasonal and perennial heave mounds and thermokarst associated with injection ice here are poorly developed in the Nerchinsk region. And in the Upper Argun subdistrict, perennial heaving mounds are especially numerous in the upper reaches of the Urulungui River. To the south, their number and size are noticeably decreasing. Seasonal heaving mounds are common throughout the Southeastern Transbaikalia, especially in its central part. Their diameter ranges from 2-3 to 20-30 m, height – from 0.5-1 to 2-3 m. The length of oblong mounds, as established by I.Ya.Baranov[8], sometimes reaches 100 m, and their width is 1.5-2 m. The structure of seasonal mounds is also different: among them there are mounds with an ice core, and mounds with a core of alternating ice and soil layers. The latter were observed near S.Udycha, near the Abagaitui mine. Seasonal mounds are usually confined to the bottoms of valleys, falls and hollows and to the foothills of the slopes of the predominantly southern exposure.[7] The Charskaya basin is one of the few areas of northern Transbaikalia where seasonal heaving mounds with a powerful ice core have been encountered (Fig. 1-6), however, there is little detailed information about them[9] and there are almost no isotopic characteristics, and therefore the study of their morphological and isotope-geochemical properties is very relevant. It can be confidently stated that the seasonal heaving mounds found in the Charskaya basin are perhaps the most expressive seasonal cryogenic formations in the cryolithozone of Russia and contain ice lenses reaching a thickness of 1-2 m, with a diameter of several tens of meters (see Fig. 1-3). 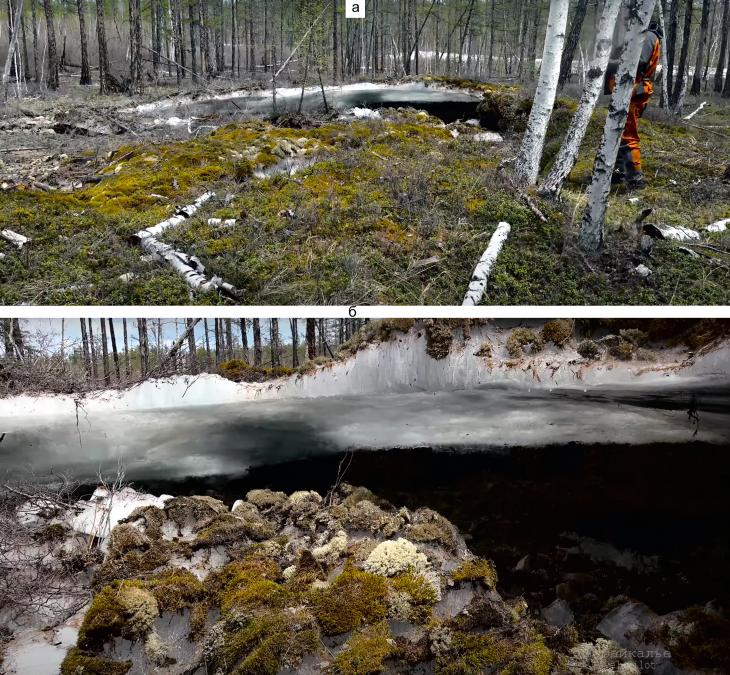
Fig. 1. Seasonal injection heaving mound in the Charskaya basin in Transbaikalia: a – general view, b – ice lens in the upper part of the mound. Photo by Pavel Pilot, from the website: https://yandex.ru/video/preview/6028501455540695274 In spring, during the maximum rise of soils, the size of annual heave mounds reaches 10 m in height and from 20 to 100 m across. Usually, large amounts of soil heaving are typical for narrow (80-100 m) sections of valleys, where zones with injection heaving are formed against the background of the development of segregation heaving, and in total the heaving reaches significant values. For example, in the fields of Sour and Sennaya (Chita region) the height of the injection heave mounds reaches 8-9 m with a diameter of 30-50 m, and in the Muysk and Charskaya depressions, along the valleys of the Khana, Olekma and Nyukzha rivers, the height of the heave mounds varies from 1.5 to 10 m, diameter – from 20 to 100 m. Long-term heaving mounds are found in the above-mentioned depressions and river valleys, and in the valley of the Shilka River, V.K. Laperdin observed heaving mounds 7-8 m high and 40-50 m in diameter, which persisted for no more than three years and disappeared. The age of the “centenarians" – long-term heave mounds in the Charskaya basin – reached 300 years, height 16 m, diameter 80-100 m. The destruction of large perennial mounds in the relief is expressed by thermokarst sinkholes, craters, lakes with an area of up to 0.5 km2.[10] 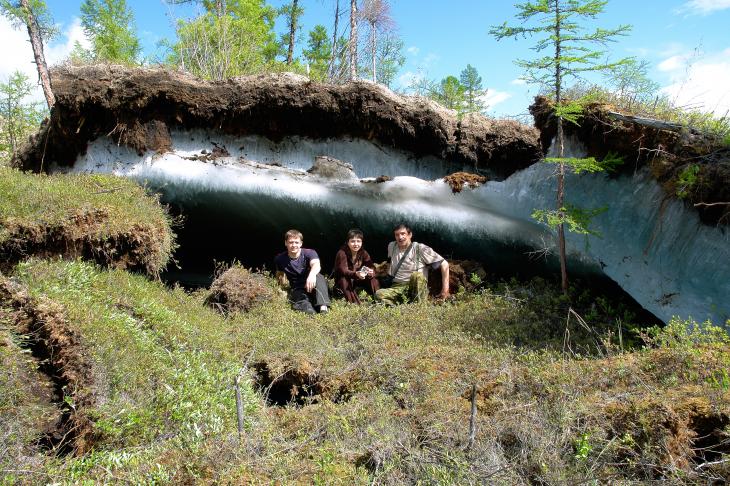
Fig. 2. Seasonal injection bulge with a powerful ice lens under a meter layer of peat in the upper part of the hillock in the Charskaya basin, in Transbaikalia. Photo by V.G. Podgorbunsky 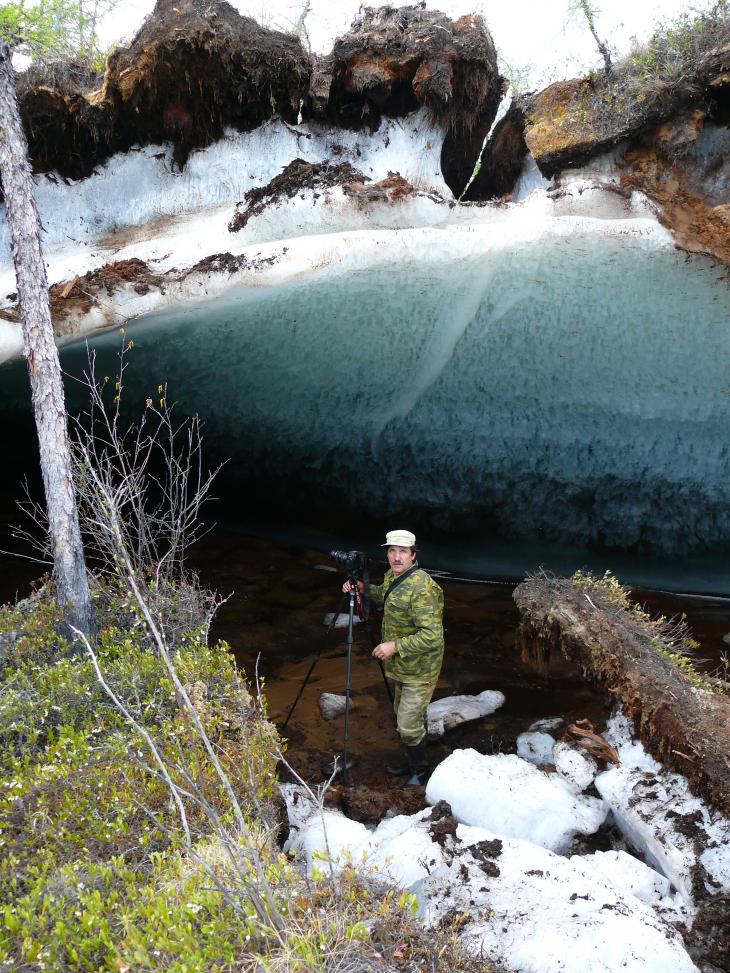
Fig. 3. Seasonal injection bulge with a powerful ice lens in the Charskaya basin, in Transbaikalia. Photo by V.G. Podgorbunsky 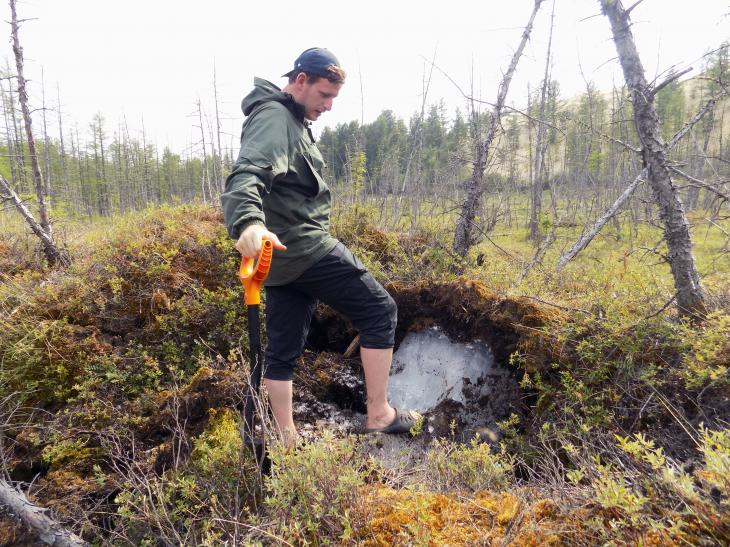
Fig. 4. Seasonal injection bulge of heaving, in the Charskaya basin in Transbaikalia. Photo by A.Ginzburg Seasonal heaving mounds in the Charskaya basin begin to actively thaw and disintegrate at the beginning of summer (Fig. 5) and by the end of summer, impressive funnels, up to 1 m or more deep, remain at the site of thawing of the ice cores of seasonal heaving mounds (Fig. 6). 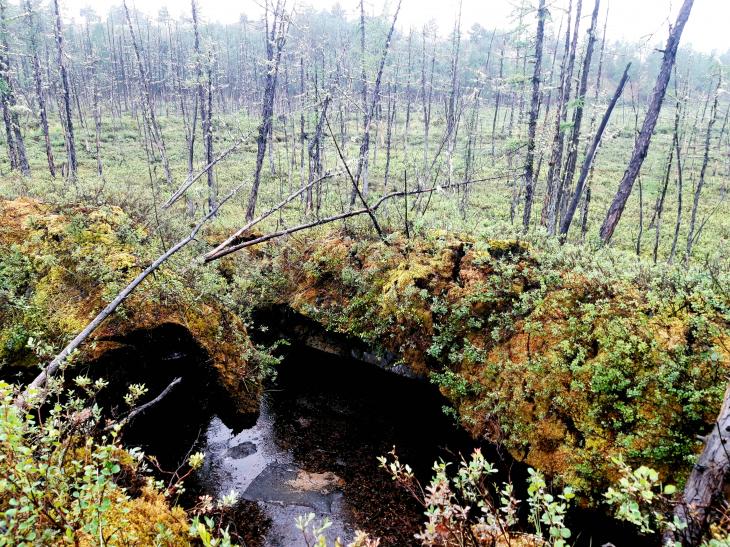
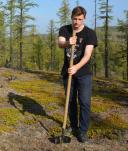
Fig. 5. Pulling out the ice core of a seasonal peat heaving mound near the Charsky sands in July 2022. Photo by V.Palamarchuk 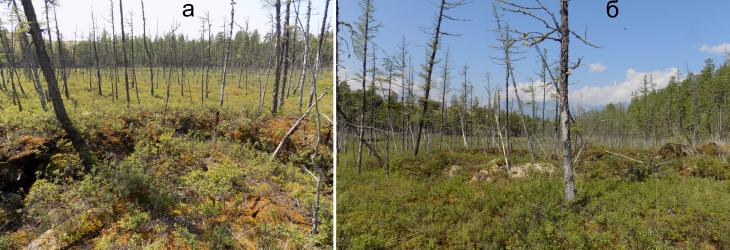
Fig. 6. Funnels at the site of thawing of seasonal heave mounds in the Charskaya basin, in Transbaikalia. Photo by A.Ginzburg
The aim of the work is a detailed study of the isotopic composition of ice lenses in the core of seasonal heave mounds in the Charskaya basin, identification of the direction and freezing conditions recorded in the isotope record, establishment of the isotopic composition of the water from which ice lenses were formed in the core of seasonal heave mounds and comparison of isotopic curves on the ice of seasonal heave mounds in the Char with isotopic data from the ice of seasonal mounds studied in different areas of the cryolithozone of Russia and Canada. Physical and geographical conditions of the research area The Charsky Sands sandy massif is located between the Upper and Middle Sakukan rivers in the central part of the Charsky basin (56°50’43.61” s.w., 118°08’25.78” v.d.), its area is approximately 9.5 × 3.6 km, and the absolute height reaches 811 m (Fig. 7). 
Fig. 7. Cartography of the research area near the Charsky sands: 1 – the scale of heights of the sand massif; 2 – the scale of heights of the surrounding area; 3 – the places of formation of ice; 4 – the locations of the studied heave mounds. The massif itself is a series of loose, shifting sand dunes, mostly crescent-shaped in shape. The slopes of the massif, especially in the southern and southeastern parts, are very steep, reaching 35-35 °, in the northern part they are more gentle. Funnel-shaped forested and swampy depressions developed in conditions of degraded drainage are also often observed in the northern part of the sandy massif. According to these depressions, the groundwater of sandy massifs is discharged, streams and channels are formed in them, and a relatively cool microclimate is formed. Geological and geomorphological features of the territory The thickness of the pre-quaternary sediments is represented by a powerful folded foundation of predominantly magmatic occurrence. Archean-Proterozoic granites, granodiorites, gabbro, gabbro-dorites, etc., permeated by Lower Proterozoic and Late Jurassic intrusions, dominate among the basement rocks.[11] In some parts of the territory, the surface is composed of sedimentary chalk-quaternary strata, most of the bottom of the basin is composed of a polygenetic quaternary cover, the thickness of which varies depending on the manifestations of pre-quaternary relief. The foothill parts of the bottom of the basin are composed of glacial, water-glacial and slope sands, sandy loams and boulder loams. Closer to the riverbed of the Chara river, most of it is composed of Late Quaternary, including Holocene alluvium – medium and large sands with layers of gravel and gravel.[12] The bedrock-folded bedrock slopes of the Kodar ranges, steeper, and Udokan, more gently sloping, descend into the exposed bottom of the Charskaya basin, the relief of which is complicated in places by naturally morainic ridges and water-glacial terraces, as well as sub-mountain plumes, the sediments of which contain fragments of rock. The lowest geomorphological levels are floodplains and low floodplain terraces, rising on average 5-10 m above the water level.[13] The deposits of terraces and floodplains of the Chara River and its tributaries contain re-vein ice, the active extraction of which leads to the formation of numerous ravines and gullies, as well as to the rapid retreat of the banks. Permafrost rocks and cryogenic processes The Charskaya basin is located in the region of continuous low-temperature permafrost rocks (MMP), however, due to the fragmentation of the relief, the diversity of their exposures and the heterogeneity of the properties of the soil and vegetation cover, the variegation of the temperature field and iciness of the MMP is manifested.[14,15] The lowest temperatures of the MMP at depths of zero seasonal fluctuations are observed in the kurums of the slopes of the Udokan ridge, it is about -9.4 °C.[15] In the landscapes of sub–mountain plumes, sandy and sandy loam terraces, MMP temperatures occasionally reach values of -4, -3°C, and on unpaved sandy massifs like the Charsky sands, this temperature is generally positive - about +0.3°C.[15,16] Non-penetrating talik zones are common under riverbeds.[17] Seasonal thawing in the Charskaya basin begins in early May and ends in October. Deep freezing in winter is facilitated by the low power of the snow cover, as well as the average low power of the vegetation cover. The average maximum capacities of the seasonally shallow layer (STS) reach 1-1.5 m, and on the transported sand massifs it is 6-8 m, while in their thickness non–iridescent MMPs are formed - at a depth of 8-15 m, the sands have near-zero positive temperatures.[15,18,19] A variety of cryogenic processes and phenomena are developed on a relatively small area of the Charskaya basin. The most common are complexes of slope processes of two types – the char middle mountains and the sparsely wooded taiga middle and low mountains.[14] The first type includes active cryogenic precipitation, subsurface flushing, char ice formation, cryogenic weathering, etc. A feature of the structure of the char-tundra slopes of mountain ranges are numerous kurums – massifs of crushed stone and boulders with MMP at the base.[19,20] The second type includes thermal erosion and thermosolifluction, which modify the meso- and microrelief of slopes formed during the cold period of the Middle and Late Pleistocene.[21] Cryogenic cracking and heaving of rocks are very widespread in the flat parts of the territory of Northern Transbaikalia, Southern Yakutia and the Far Eastern region.[9,14] As a result of groundwater discharge, powerful ice forms on rivers, often destroying communication routes and changing the morphology of riverbeds.[22] Climatic conditions The Charskaya basin is located in an area of sharply continental climate, while the position between high and extended mountain ranges contributes to the significant isolation of this territory from regional atmospheric circulation, bringing to the fore local microclimatic features – primarily mountain-valley air circulation.
The average annual air temperature in Char is -6.6°C due to very low winter temperatures. The coldest month of the year is January, whose temperature dropped to -31.8°C on average during the observation period, and the warmest is July, when the air warmed up to +16.8°C on average. The minimum temperature for the period of meteorological observations was established in February 1969, it reached -56.2°C, the maximum in June 1954, it was +35.0°C (Fig. 8). Air temperature transitions over the 0°C mark in the Char are observed mainly in the first half of April and in late September – early October. The annual course of air temperature has a rather smooth shape. The increase in average annual air temperature over the past 85 years is relatively low, the gradient of air temperature growth in January is 0.046°C/year (or 0.44°C/10 years), the gradient of temperature growth in July is 0.01°C/year (0.09°C/10 years), and the increase in average annual air temperature is 0.024°C/year (0.22°C/10 years). Thus, winter and average annual temperatures grow slowly, and summer temperatures grow even more slowly (see Fig. 8). 
Fig. 8. Climate in the village Chara in the period from 1938 to 2023: 1 – average annual precipitation; average air temperatures: January 2; July 3; 4 – per year; and equations of trend lines of air temperature growth during this period (according to the Chara weather station[23] The average annual rainfall here is 381 mm. The variation over the last 85 years has occurred in wide ranges – from 132 to 596 mm/year. The intra-annual precipitation distribution is extremely heterogeneous, in the winter months the amount of precipitation rarely exceeds 5 mm/month, in spring this amount increases by about 10-20 times (up to 50-100 mm/month), and in summer it reaches 120-150 mm or more. Strong spring and summer floods on rivers are associated with sharp increases in the amount of precipitation.[24] Soil and vegetation cover The soil cover of the bottom of the basin is characterized by low mosaic, its structure is dominated by gleesems and peat-gleesems of mainly sandy granulometric composition under moist sedges, sedges-moss and sedge-mixed plant communities. They are formed on alluvial sands, as well as small areas of peat-gleezems are formed on loamy frozen lake and lake-alluvial deposits in conditions of shallow (up to 0.5 m) from the surface of the MMP roof. On elevated terrain areas composed of coarse-grained well-sorted sands, under sparse forests of Siberian larch (Larix sibirica), powerful profiles of illuvial-ferruginous podzols develop, thawing deeply in the warm season.[25] Within the Charsky Sands sand massif, fragmentary areas of psammozems are formed, interspersed with wide expanses of unpaved sands.[26] Vertical distributions of the gross content of the chemical composition of soils are characterized by relatively monotonous distributions of most of the macronutrients – Mg, Ca, Ti, Mn. Their average contents are relatively low – up to 1% (less often up to 2.5). The upper parts of the soil profiles on sandy rocks are mostly depleted of macronutrients, with the exception of Mg. The values of the radial differentiation coefficients in the upper parts of the profiles range from 0.3 to 0.7. The MMP horizon, in comparison with the horizons of the soil STS, is enriched with some elements, for example, Si (gross content is 9-25%) and Al (1.3–2.4%).[27] The most common types of radial soil-geochemical structure of cryogenic landscapes of the Charskaya basin are combinations of the lessized and illuvial types within the catena near the village. Novaya Chara, as well as humus-eluvial and humus-illuvial within the catena of the Kodar National Park (Charsky Sands). The lateral soil-geochemical structure indicates the relative uniformity of the distributions of most of the chemical composition of soils.[28,29] Objects of research The objects of research are three relatively low seasonal peat heave mounds located in the northwestern part of the Charsky Sands sandy massif in depressions resulting from erosion of the sandy massif by groundwater flow (Fig. 9). The studied mounds have heights of 80-120 cm, the upper 20-30 cm of peat were thawed at the time of the study, below was frozen peat and layers of ice. 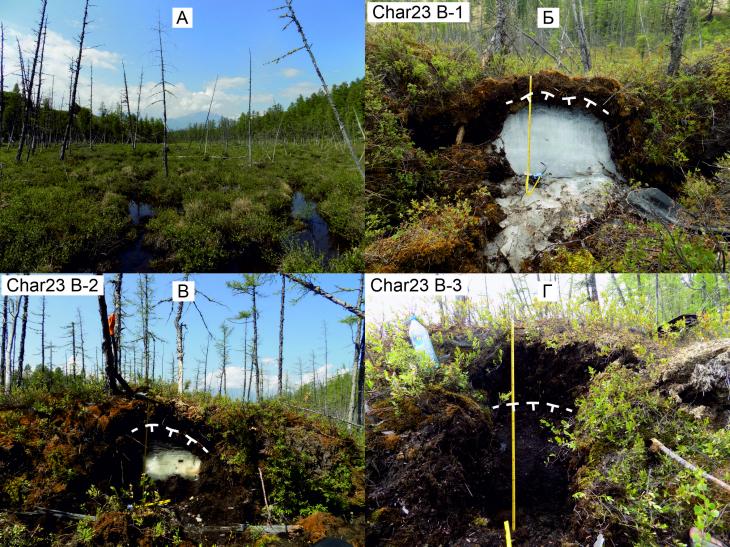
Fig. 9. Objects of study: A – swampy lowering of the thermosuffusion funnel in the Northwestern part of the Charsky sands; B, C, D – heave mounds Char23 B-1, Char23 B-2 and Char23 B-3. The dotted line with serif marks the upper border of the MMP in the profiles of the hillocks, the serifs are directed towards the MMP. Photo by V.A. Palamarchuk The upper part of the incisions laid on the mounds reveals modern vegetation of moss-sphagnum botanical composition, sometimes permeated with living roots and containing remnants of woody vegetation. Below lies a more decomposed peat of dark brown color and similar plant composition, directly under the STS this peat is frozen, most often has a massive cryotexture, low and medium iciness. The ice cores of the heaving mounds consist mainly of transparent and translucent white ice with pronounced vertical or horizontal layering. Occasionally, such layers are replaced by less powerful gray opaque layers of ice containing a small amount of ground particles. In the section of the Ch-23-2 hillock, another layer of peat of high visually assessed iciness and porphyry cryotexture was found under the ice layers. In the section of the Ch-23-3 hillock, a layer of thawed gray moisture-saturated sand was found under layers of frozen peat, which was largely stained with finely dispersed particles of organic matter (Fig. 10). Layered descriptions of the structure of the studied mounds 1. Hillock Ch-23-1
The height of the tested part: 80 cm; Peat capacity: 0-20 cm; STS capacity: 15 cm. · Layer 1: Modern sphagnum-moss cover, 0-5 cm; loose, almost dry, reddish-brown. · Layer 2: Peat thawed sphagnum-moss with fragments of woody vegetation, 5-15 cm; medium degree of decomposition, loose, fresh, dark brown. · Layer 3: Frozen sphagnum-moss peat with fragments of woody vegetation, 15-20 cm; medium degree of decomposition, medium iciness, massive cryotexture, dark brown to black. · Layer 4: Gray ice, 20 – 28 cm; opaque, with a lot of air bubbles, fragile. · Layer 5: White ice, 28 – 70 cm; translucent, vertically layered, without obvious inclusions, increased strength. · Layer 6: Gray ice, 70-80 cm; opaque, with a lot of air bubbles, fragile, with rare inclusions of mineral soil. 2. Hillock Ch-23-2 The height of the tested part: 90 cm; Peat thickness: 0 – 35 and 70 – 90 cm; STS capacity: 30 cm. · Layer 1: Modern sphagnum-moss cover with fragments of woody vegetation, 0-8 cm; loose, almost dry, reddish-brown. · Layer 2: Peat thawed sphagnum-moss with fragments of woody vegetation, 8-27 cm; medium degree of decomposition, loose, fresh, dark brown. · Layer 3: Frozen sphagnum-moss peat with fragments of woody vegetation, 27-35 cm; medium degree of decomposition, medium iciness, massive cryotexture, dark brown to black. · Layer 4: The ice is horizontally layered, 35-54 cm; the interlayers are transparent and gray opaque, with a small number of air bubbles. · Layer 5: White ice, 54-70 cm; transparent, without signs of layering, without obvious inclusions, increased strength. · Layer 6: Frozen sphagnum-moss peat with fragments of woody vegetation, 70-82 cm; medium degree of decomposition, high iciness, porphyry cryotexture, dark brown to black. · Layer 7: Frozen sphagnum-moss peat with fragments of woody vegetation, 82-90 cm; high degree of decomposition, medium iciness, massive cryotexture, dark brown to black. 3. Hillock Ch-23-2 Height of the tested part: 120 cm; Peat capacity: 0 - 120 cm; STS power: 50 cm. · Layer 1: Modern sphagnum-moss cover with fragments of woody vegetation, 0-15 cm; loose, almost dry, reddish-brown. · Layer 2: Peat thawed sphagnum-moss with fragments of woody vegetation, 15-50 cm; medium degree of decomposition, loose, fresh, dark brown. · Layer 3: Frozen sphagnum-moss peat with fragments of woody vegetation, 50-100 cm; medium degree of decomposition, medium iciness, massive cryotexture, dark brown to black. · Layer 4: Thawed, moisture-saturated sand, 100-120 cm; gray, sluggish, loose. Selected samples. In total, during field studies in 2023, 23 ice samples from ice cores were selected from the studied heaving mounds (Fig. 11, Table. 1) and 24 peat samples, including 2 of them for radiocarbon analysis (see Fig. 10). 
10. Lithological-stratigraphic and cryolithological structures of the profiles of the studied heave mounds: A – Ch-23-1, B – Ch-23-2, C – Ch-23-3. 1 – modern vegetation cover; 2 – thawed peat; 3 – frozen peat; 4 – thawed sand; 5 – transparent ice; 6 – bubbly ice; 7 – vertically layered ice; 8 – horizontally layered ice; 9 – ice; 10 – massive cryotexture; 11 – porphyry cryotexture; 12 – MMP boundary (strokes are directed towards the frozen thickness); 13 – sampling points to determine the values of δ 2 H and δ 18 O; 14 – peat sampling points for radiocarbon analysis (14 C)

Fig. 11. Sampling from heave mounds: a – Ch-23-1, b – Ch-23-2. Photo by A.Ginzburg Research methods Samples of peat and ice were taken from the cleaned sections in the centers of the mounds. Peat was selected with a metal knife, the weight of each sample was 100-150 g. Peat in plastic bags with a sealed zip-lock was transported to the laboratory, where it was dried and crushed at room temperature. Ice samples were taken by drilling out of the ice wall outcrop with a diamond-coated metal crown using a Bosch GSR 36V LI-ion electric drill (Germany). The ice samples were thawed at room temperature and poured into plastic vials, sealed and transported to the laboratory. Laboratory isotope studies of ice from the core of seasonal heave mounds Measurements of the isotopic composition of oxygen and hydrogen of ice were performed using a Picarro L 2130-i laser infrared spectrometer at the X-ray Diffraction Research Methods Resource Center at the Scientific Park of St. Petersburg State University. The following international standards are used: V-SMOW-2, GISP, SLAP, USGS-45 and USGS-46. The error of the definitions was: for δ18 O – ± 0.02 %, for δ2 H – ± 0.3 %. The values of the deuterium excess (d exc) were calculated using the formula of V.Dansgor[30]: d exc = δ 2 H – 8δ 18 O. A total of 23 ice samples from the cores of seasonal heave mounds were analyzed (see Table 1). Table 1. List of samples for determining the isotopic composition of seasonal heave mounds in the Char | Sample number | Depth, m | Sample number | Depth, m | | Chara 1 Seasonal Hill (Char23 B-1) | Chara 2 Seasonal Hill (Char23 B-2) | | Char23 B-1/01 | 0-5 | Char23 B-2/01 | 0-5 | | Char23 B-1/02 | 5-8 | Char23 B-2/02 | 5-11 |
| Char23 B-1/04 | 17-22 | Char23 B-2/03 | 11-16 | | Char23 B-1/05 | 22-29 | Char23 B-2/04 | 16-21 | | Char23 B-1/06 | 29-35 | Char23 B-2/05 | 23-28 | | Char23 B-1/07 | 35-42 | Char23 B-2/06 | 29-35 | | Char23 B-1/08 | 42-50 | Char23 B-2/08 | 16-21 | | Char23 B-1/09 | 50-55 | Char23 B-2/09 |
16-21 | | Char23 B-1/10 | 22-29 | Char23 B-2/10 | 5-11 | | Char23 B-1/11 | 22-29 | Char23 B-2/11 | 5-11 | | Char23 B-1/12 | 22-29 | Char23 B-2/12 | 5-11 | | | | Char23 B-2/13 | 5-11 | The radiocarbon age was determined by liquid scintillation in the Laboratory of Geomorphological and Paleogeographic Studies of the polar regions and the World Ocean, St. Petersburg State University. Results Radiocarbon age of peat overlying the ice core of seasonal heave mounds. The obtained data on the absolute age of peat of seasonal mounds in the Char indicate the current accumulation of peat (Table 1). Table 2. The results of the determination of the absolute age by the radiocarbon method samples from peat of seasonal mounds in the Char | Lab. Number | Field number of samples, dating material, depth | Radiocarbon age, years | | LU-11281 | No. 1. Char-23-peat-2-14 S/1, depth 0.35 m. | pmc = 1.262±0.011 modern |
| LU-11282 | No. 2. Char-23-peat-2-14 S/2, depth. 0.8 m . | pmc = 1.221±0.009 modern | Isotopic composition of the ice core of seasonal heave mounds. The isotopic composition of the ice core of seasonal heave mounds 1 and 2 varies markedly in several ways (Tables 3 and 4): in heave hill 1, the values of δ18 O vary from -16.59 to -19.06% (the average value of δ18 O = -17.60%), the values of δ2 H vary from -129.3 to -144% (the average value of δ2 H = -135%); in the heave hill 2, the values of δ18 O vary from -15.39 to -19.25% (the average value of δ18 O = -17.48%), the values of δ2 H vary from -122.6 to -145.5% (the average value of δ2 H = -134.7%). Table 3. Isotopic composition of ice of seasonal heave mounds in the Charskaya basin, July 2023 | Sample number | Chapter, see | δ18O, ‰ | δ2H, ‰ | dexc | Sample number | Chapter, see | δ18O, ‰ | δ2H, ‰ | dexc | | Chara 1 Seasonal Hill (Char23 B-1) | Chara 2 Seasonal Hill (Char23 B-2) | | Char23 B-1/01 | 0-5 | –16,59 | –130,8 | 1,9 |
Char23 B-2/01 | 0-5 | –16,65 | –129,8 | 3,4 | | Char23 B-1/02 | 5-8 | –16,71 | –129,3 | 4,4 | Char23 B-2/02 | 5-11 | –17,00 | –131,6 | 4,4 | | Char23 B-1/04 | 17-22 | –17,08 | –131,3 | 5,3 | Char23 B-2/03 | 11-16 |
–17,48 | –135,3 | 4,5 | | Char23 B-1/05 | 22-29 | –17,36 | –133,0 | 5,9 | Char23 B-2/04 | 16-21 | –18,22 | –139,3 | 6,5 | | Char23 B-1/06 | 29-35 | –17,82 | –136,1 | 6,5 | Char23 B-2/05 | 23-28 | –18,13 | –139,0 |
6,0 | | Char23 B-1/07 | 35-42 | –18,18 | –138,5 | 6,9 | Char23 B-2/06 | 29-35 | –15,39 | –122,6 | 0,5 | | Char23 B-1/08 | 42-50 | –18,75 | –141,5 | 8,5 | Char23 B-2/08 | 16-21 | –18,29 | –139,1 | 7,2 | | Char23 B-1/09 |
50-55 | –19,06 | –144,0 | 8,5 | Char23 B-2/09 | 16-21 | –19,25 | –145,5 | 8,5 | | Char23 B-1/10 | 22-29 | –17,32 | –133,5 | 5,1 | Char23 B-2/10 | 5-11 | –17,18 | –133,1 | 4,3 | | Char23 B-1/11 | 22-29 | –17,26 |
–132,3 | 5,8 | Char23 B-2/11 | 5-11 | –17,32 | –133,5 | 5,1 | | Char23 B-1/12 | 22-29 | –17,51 | –135,0 | 5,1 | Char23 B-2/12 | 5-11 | –17,43 | –134,4 | 5,0 | | | | | | |
Char23 B-2/13 | 5-11 | –17,38 | –133,4 | 4,6 | Table 4. Minimum, average and maximum values of δ18 O, δ2 H and d exc ice of seasonal heave mounds in the Charskaya basin | The number of the hill | Point number | Number of units | δ 18 O (%) | δ2H (‰) | dexc (‰) | | mines. | Wednesday. | max. | mines. | Wednesday. | max. | mines. |
Wednesday. | max. | | Seasonal hill Chara 1 | Char23 B-1 | 11 | –19,06 | –17,60 | –16,59 | –144 | –135 | –129,3 | 1,9 | 5,8 | 8,5 | | Seasonal hill Chara 2 | Char23 B-2 | 12 | –19,25 | –17,48 |
–15,39 | –145,5 | –134,7 | –122,6 | 3,4 | 5,0 | 8,5 | If we compare the isotopic composition of the ice core of seasonal heave mounds, for example, with the summer water of the Chara rivers (the value of δ18 O is -18.28, the value of δ2 H = -139.5), Neryungri (the value of δ18 O is -20.9, the value of δ2 H = -162) or Berkakit (the value of δ18 O is -17.8%, the value of δ2 H = -135.6%)[31-34] , then the ice of the ice core of seasonal mounds is generally isotopically close to the isotopic composition of river waters in summer, but the most isotopically heavy ice of the mounds is naturally isotopically heavier than river waters, due to fractionation during the transition of the first portions of the seasonally thawed layer into ice. Discussion The study of the ice of seasonal heave mounds Seasonal injection, injection-segregation and segregation heave mounds are quite widespread in the area of insular, intermittent and continuous permafrost distribution. Their formation can occur every winter in the areas of groundwater discharge or when the waters of the seasonally thawed layer freeze.[35-37] The process of forming an injection bump is often two-step. At the first stage, the surface actively bulges due to the fact that the hydrostatic pressure of the waters in the active layer exceeds the pressure of the overlying rock layer. During the second stage, growth occurs much more slowly, as the water in the core of the hillock gradually freezes out. R. van Everdingen describes the formation of seasonal heaving mounds in artificially created arrays of frozen soils, for example, near the Trans-Alaska oil pipeline, along the embankment of the roadbed of the Dempster Highway, Northwest Territories, Canada, along a section of the highway in Alaska, as a result of improper operation of an artesian well in the Fairbanks area.[38] The seasonal mounds studied by R. van Everdingen in the Bear Rocks had an oval shape and sizes from 20 m on the short axis to 65 m on the long axis, their height varied from 2.5 to 5 m.[38] The formation of mounds begins at the end of December, and in the early stages their growth rate can reach 0.55 m/day, which is much higher than the speed of ordinary frost heaving. The destruction of the mounds occurs in late April – early May and is accompanied by subsidence of the surface, sometimes quite rapid: up to 1.35 m for several days. Some small fragments of seasonal mounds persisted until mid-September. The internal structure of a typical seasonal heaving mound in Bear Rocks is as follows (from top to bottom): a layer of frozen soil, for example peat, with a thickness of 20 to 85 cm, the lower 10-15 cm of which in some cases contain lenses of segregation ice, is underlain by a layer of pure ice with a thickness of 25 to 85 cm. There are often voids under the ice layer, the maximum height of which is 1.1 m. On the inner surface of the voids, marks of the horizontal water level are visible, indicating that during the formation of heave mounds, the voids were most likely filled with water. R. van Everdingen showed that there is no correlation between average winter temperatures, the height of the snow cover and the number, position or size of the seasonal heave mounds formed. It has been established that mounds can form in soils with wide variations in granulometric composition.[38,39] K.Hinkel and co-authors[40] described a group of seasonal heaving mounds with ice cores formed in the winter of 1995-1996 near Barrow, Alaska, in the drained basin of thermokarst lake. In mid-August 1996, they discovered more than 20 mounds with a diameter of 5 to 20 m. Ice cores obtained from the center and edge of one of the mounds indicate a lateral underground injection of water during the freezing of the seasonally thawed layer.
M.Y.Golubchikov and co-authors[41] described the formation and disintegration of a seasonal injection bulge formed in the thickness of a subsurface talik near the city ofNorilsk. A man-made heaving mound formed in the cavity of the subsurface talik as a result of the release of a large amount of water during a water supply accident on May 18, 2004. The leak was eliminated within one day, but a significant amount of water probably managed to filter into the subsurface talik of the stream flowing at this place. A bulge formed about 200 m downhill from the pipeline. Ice formed on the surface of the snowfield between the pipeline and the hydrolaccolith, apparently fixing the place of water filtration in the subsurface talik. The size of the ice at the time of the first observations (June 17, 2004) was about 10 m in diameter. At the time of the first observation, the heaving mound was about 4 m high, and had an elongated, rounded shape, its longitudinal dimensions were about 60 m, and its transverse dimensions were about 28 m (Fig. 12). The ice that opened in the core of the mound was blue and transparent, and in the center it was replaced by white, layeredfrozen, formed, apparently, as a result of cracking of the ice core and freezing of meltwater in the crack. The width of this re-frozen ice was about 60 cm, and the length was about 11 m. The white ice that filled the cracks in the transparent ice core consisted of crystals about 5 cm long and directed perpendicular to the walls of the crack (Fig. 13). By July 7, the hillock had deteriorated significantly. 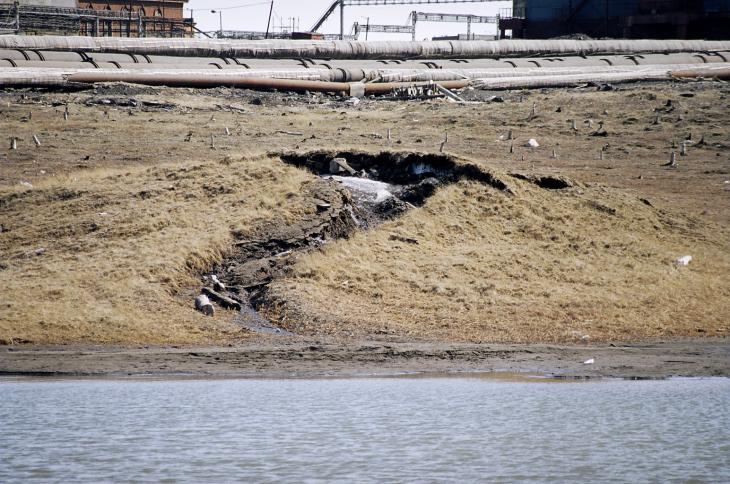
Fig. 12. Seasonal injection bulge of man-made heaving, formed in the thickness of the subsurface talik near the city ofNorilsk. Photo by E. Perminova 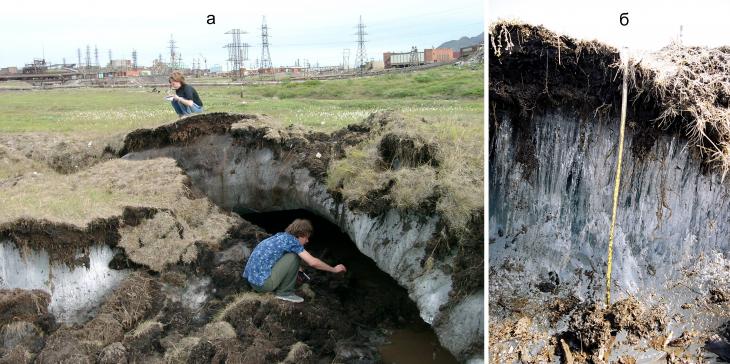
Fig. 13. Ice core (a) and ice structure (b) of a seasonal injection hummock of man-made origin near the city ofNorilsk. Photo by E. Perminova The ice in the center of the crack thawed, and a grotto was formed on the left side, about 130 cm high and about 3 m deep. The last observation of the condition of the hydrolaccolite was made on July 22. The hot weather conditions in the summer of 2004 led to the complete destruction of the hydrolaccolite. The bulge of heaving was almost level with the ground, and a depression formed in the center of it, about 1 m deep.[41] Seasonal mounds are particularly dangerous for the operation of linear structures: pipelines, railways and highways, airfields. S.E.Grechishchev and Yu.B.Sheshin[42] described two cases when there was a significant frosty heaving of sand deposits under the runway. At the airfield located on the territory of the cryolithozone in the village. Amderma during the freezing process, a situation was created when the frozen layer closed with the underlying permafrost rocks in relatively dry areas, and freezing was delayed in the watered part and a hydraulically closed volume of water-saturated soil with a capacity of 0.3-0.5 m was formed. Later, it froze and at the moment when the depth of freezing reached the groundwater level, an additional pressure arose, leading to the self-discharge of water to the surface. Ice sheets and ice mounds formed here, which caused the heaving of the massif (Fig. 14). 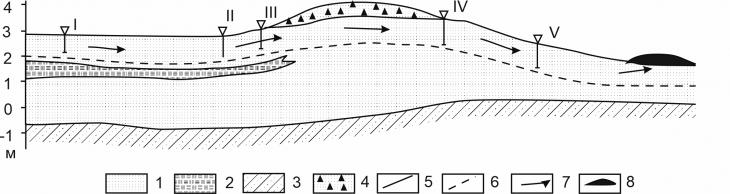 Fig. 14. The development of runway deformations in the eastern section of the airfield of the village. Amderma, due to segregation and segregation-injection ice formation, which led to heaving (according to S.E.Grechishchev, Yu.B.Sheshin[42]: 1 – sand; 2 – layering of peat and sand; 3 – layering of dark–colored sandy loams, loams, sand (silt); 4 - filling of crushed stone; 5 – asphalt concrete pavement of the runway; 6 - the boundary of the STS; 7 – the direction of movement of the waters of the STS during freezing; 8 – ice mounds; I-V – well numbers On the territory of another airfield, located in a zone of deep seasonal freezing (i.e. without permafrost), a sand fill under the runway with a capacity of 0.5-1.2 m was laid on dense clays. The filling was completely flooded due to malfunctions of the drainage system. The freezing depth is about 1.2 m. The surface of the clays under the sandy filling is uneven, and at a distance of 300 m, the filling capacity varies smoothly from 1 to 0.4 m. When it freezes to a depth of 0.4-0.5 m, a hydraulically closed volume was created in the sand, limited by waterproof walls: a frozen layer of sand on top, clay on the sides and bottom. The capacity of this closed volume is about 0.4–0.5 m. In the future, it froze, as it was entirely within the seasonally frozen layer. When the closed volumes formed froze, pore pressure arose, which led to bending of the frozen sand layer. Even with one-dimensional freezing of water-saturated sands or gravel-pebble soils, the waters of the seasonally shallow layer become pressurized, acquiring additional pressure, which makes it possible for them to self-discharge to the surface if there are conditions for drainage. In particular, such a drain may be a heated building with a underfloor heating on the first floor (i.e. a building built without ventilated subfloors). So, in the 60s, in November-December, the earthen floor of the warm hangar of the Yakutsk airport was constantly flooded with groundwater.
P. Morse and K. Bern[43] investigated low seasonal mounds on the surface of roller concave polygons on the Big Lake Delta plain, in the outer part of the Mackenzie River delta. In 2008 and 2009, drilling of 12 seasonal heave mounds was performed in order to describe their morphological varieties and study their growth processes. Seasonal heaving mounds containing an ice core with a thickness of 15 to 58 cm had a height of less than 1 m and a diameter of 3 to 8 m; some mounds had a length of more than 10 m. Organic inclusions in the ice, bubble density, electrical conductivity profiles and the structure of ice crystals indicated that the mounds arose as a result of hydrostatic pressure. M. Puckett and co-authors[44] performed cryostratigraphic studies of the formation of underground ice and seasonal heave mounds in the Arctic polar desert near Resolute Bay, Nunavut. With.Ponti and colleagues[45] examined the spatial and temporal variability of ice mounds along the Antarctic coast in Boulder Clay (north of Victoria Land). They compared the images of two seasonal heaving mounds and recorded their opposite trends. The first seasonal hillock with an ice core was higher in the past (1996-2004) than in recent years (2014-2019), while the second seasonal hillock with an ice core showed the opposite trend. Variations in the isotopic composition of the ice of seasonal heave mounds The isotopic composition of the ice of the Russian seasonal heave mounds has been studied at few points. Earlier in the seasonal heaving mounds (Fig. 15) in the valley of the Chary Yu river.Vasilchuk and co-authors[31] published the results of two determinations of the isotopic composition of ice from the core of a seasonal bulge: from a depth of 0.5 m, the value of δ18 O is -15.1%, the value of δ2 H is -124.4%, and d exc = -3.9%; from a depth of 0.4 m, the value of δ18 O is -15.4%, the value of δ2 H is -123.7and d exc = -0.6%.
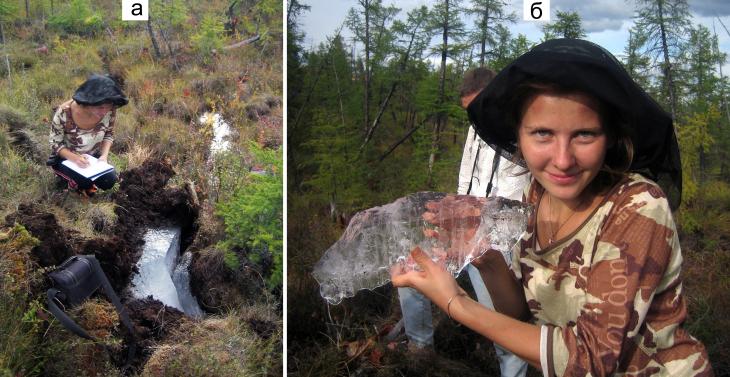
Fig. 15. Seasonal heaving mound near the Charsky sands: a – crack at the top of the mound with an open ice core, b – ice structure (ice core of seasonal frost blister). Photo and ice selection by Yu.V. Stanilovskaya Yu.V. Stanilovskaya in 2014, during an excursion to Chinese mountain Tibet, several cores of seasonal heave mounds were tested (Fig. 16), their isotopic composition was analyzed in the laboratory of stable isotopes of the Faculty of Geography of Lomonosov Moscow State University on a Delta-V Plus mass spectrometer using the gaz-bench complex. | but | b | | 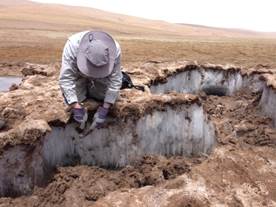
| 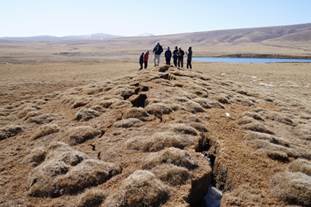
| Fig. 16. Ice from seasonal heaving mounds in Tibet. a – at an abs height of 4325 m, 35º2'42" s.w., 97º34'47" v.d., ice crystals 15-25 cm high, 0.5-1.5 cm wide. The thickness of the upper peat layer is 15-25 cm, the value of δ 2 H = -53.6%; Water from a stream nearby, the value of δ 2 H = -53.6%, Water from the river nearby, the value of δ 2 H is -51.4%; b – ice from cracks of small mounds at an abs. height of 4601 m, 34°6'54.79" s.w., 97°38'58.61" v.d., the value of δ 2 H = -60.1%, water from The thermokarst lake nearby has a value of δ 2 H =-54.7%. Photo and ice selection by Yu.V. Stanilovskaya A.K.Vasilchuk and Yu.K.Vasilchuk obtained isotope data on the ice of seasonal heave mounds studied in August 1991 in Chukotka, on the Daurkin Peninsula, in the lake area.Koolen (66 o 05 s.s., 170 o 30 s.d.) 40-45 km west of Uelen and about 80 km south, on the Chulkhevey river near the village. St. Lawrence (65 o 36 s.s., 170 o 30 s.d.), formed in a harsh marine climate. The height of these mounds is 1-1.5 m, the ice core lies at a depth of 0.4 m, its thickness is about 1 m (Fig. 17). On the ice of a seasonal hillock in the lake area.The following values of δ18 O were obtained: at a depth of 0.4 m - -13.4%, at a depth of 0.8 m - -15.3%, On the ice of a seasonal hillock in the area of the Chulkhevey River, the values of δ18 O averaged -13% at a depth of 0.4 m, -15.2% at a depth of 0.8 m, -10% at a depth of 1 m and about -11% at a depth of 1.6 m (see Fig. 17).
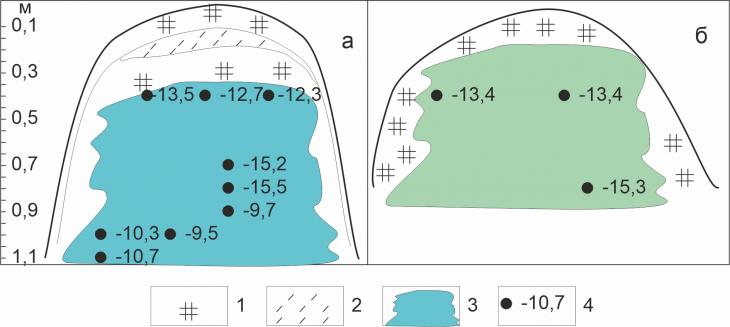
Fig. 17. Structure and isotope-oxygen composition of seasonal injection heave mounds on the floodplain of the Chulkhevey river, near the village. Lawrence (a) and on the floodplain of Lake.Koolen (b) on the Daurkin Peninsula in the east of Chukotka, about 50 km west of the village. Uelen (according to Yu.K.Vasilchuk[34]): 1 – peat; 2 – sandy loam; 3 – injection ice; 4 – values of δ18 O in ice As can be seen, the values of δ18 O in the upper part of the ice core of both heave mounds located in different regions of Chukotka turned out to be very close (Fig. 18). This reflects the close isotopic composition of atmospheric precipitation and groundwater feeding the considered heave mounds in Chukotka.
 Fig. 18. Distribution of δ18 O values by depth in the ice of seasonal injection heave mounds studied in Chukotka (according to Yu.K.Vasilchuk[34]): a – in the lake area.Koolen, b – in the area of the Chulkhevey river A sharp shift in the isotope curve observed in the ice of the seasonal heave mounds of Chukotka may indicate a break in ice formation and possibly resumed ice formation during one freezing cycle. The distribution of δ18 O values by depth in the ice of seasonal injection heave mounds studied in Chukotka indicates that samples with the least negative isotopic values (located in the lower part of the ice lens - see Fig. 20) correspond to the first portions of frozen water, and with the most negative isotopic values correspond to the last portion of water from the seasonally thawed layer before its complete freezing. It can be assumed that most of this ice was formed by freezing from the bottom up. More detailed studies of the isotopic composition of seasonal heave mounds were performed in northern Canada, [38,39,46,47] in Mongolia.[48] In Alaska, seasonal heave mounds are found in the valley of the Caribou River, where they form on the same territory with perennial injection heave mounds (bulgunniakhs). A similar joint distribution of seasonal and perennial injection heave mounds was noted in Canada, in the Bear River area, as well as in Svalbard in rather harsh permafrost conditions at an average annual temperature of permafrost rocks -5.2 o C and their thickness from 3 to 100 m.[49]
Determining the content of stable isotopes in the study of seasonal heave mounds is a tool for restoring the sequence of their development, especially the final stage of growth, at which active isotope fractionation occurs. Studies of the isotopic composition of seasonal heave mounds in northern Canada were carried out by R. van Everdingen[38] in the Bear Rocks located in the extreme southeastern part of the Norman Ridge (64 o 55'22" s.w., 125 o 39'22" s.d.) and F.A.Michael[47] in the area North Fork Pass, Northwestern Territories (64 o 35'39" s.w., 138 o 18'34" s.d.). A characteristic feature of their research areas is the intermittent distribution of permafrost rocks and the discharge of groundwater sources. Seasonal mounds of heaving and ice, which often overlap them, form every winter. During the period from 1980 to 1982, more than 65 seasonal heaving mounds were encountered in the North Fork Pass area. The content of natural deuterium isotopes (values δ 2 N), heavy oxygen (values δ 18 O) and in the ice of seasonal heave mounds (Fig. 19), groundwater and atmospheric precipitation were analyzed [38]. These studies have demonstrated that using isotope analysis, it is possible to determine whether ice layers were formed by freezing in an open system (constantly supplied with transit waters), in a closed system or under conditions of periodically seeping water, as well as to identify the source of water feeding the ice.[38,47]
 Fig. 19. Distribution of the values of δ 2 H and δ 18 O by depth in the ice of seasonal heave mounds studied in Bear Rocks, Canada. By R.van Everdingen[38]: a – ice from heave hill No. 1, b – ice from heave hill No. 2 R. van Everdingen[38] found that the source of groundwater is atmospheric precipitation, as evidenced by their close isotopic composition. The relative saturation of precipitation with stable isotopes of oxygen and hydrogen varies with the seasons. Summer precipitation is usually enriched with heavy isotopes of oxygen and hydrogen. In underground water systems, seasonal isotopic differences are smoothed out - their isotopic composition is close to the average annual precipitation composition. Thus, in rainfall at the Norman Wells weather station, the values of δ18 O vary in the range from -20 to -24.5%, in snow – from -31.5 to -31.9%; in groundwater – from -22.4 to -23.6%. The differences in isotopic composition in samples from different groundwater sources taken at the same time are from 0.7 to 0.8% for δ18 O and from 3.1 to 6.0% for δ2 H (see Fig. 19, a), and in samples from the same source taken at different times – up to 0.5% for δ18 O and up to 2.6% for δ2 H.[38] Ice samples in the upper part of the ice of the seasonal bulge of heaving No. 1 in the Bear Rocks (see Fig. 19, a) were characterized by less negative values than groundwater, which indicates positive fractionation of δ 2 H and δ 18 O during the first period of water freezing; the relief of the isotopic composition in the lower part of the ice reflects the completion stage prolonged freezing in a shrinking reservoir, which is rapidly depleted by heavier isotopes. The most negative values obtained for the base of the ice core (-26.2and -196.2 for δ18 O and δ2 H, respectively) indicate that the values of δ18 O and δ2 H in the water at the final stage of the existence of the residual basin may have reached very low values as -29 and -215Respectively. Since no cavity typical of other heaving mounds was found between the frozen ground and the ice layer in this hillock, R. van Everdingen[38] suggested that the ice here completely filled the space between seasonally frozen soil and permafrost rocks during the formation of this hillock.
A similar isotopic model was obtained for the second seasonal heaving hill (see Fig. 19, b). The weighted average values of δ18 O and δ2 H for samples from the first hill (-23.3 and -170.3%) and from the second (-22.8 and -177.1%) are similar to the average values for source water (-23.1% and -177.4%), confirming the fact that the ice layers were formed from the water sources. Isotopic data thus indicate that the ice of seasonal heave mounds was formed from groundwater in a closed system The distribution curves of the values of δ18 O and δ2 H over the ice of the seasonal heaving hill (Fig. 20), constructed by F.A.Michael[47], do not show any signs of water loss during freezing, i.e. the ice core was formed during a single freezing cycle under almost ideal conditions of a closed system.
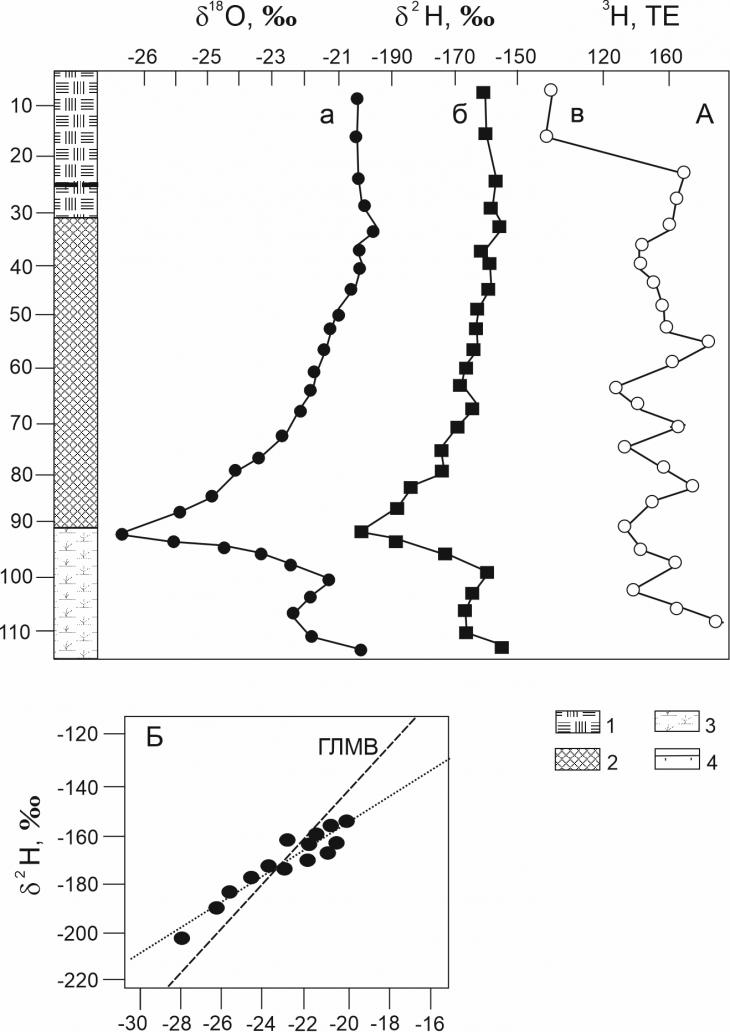 Fig. 20. A. Isotope-geochemical diagrams on the ice of a seasonal injection-segregation heave hill in the area of North Fork Pass, Yukon, northern Canada, 300 km southwest ofInuvik: oxygen (a), deuterium (b) and tritium (c) B. Regression direct ratios of isotopic atmospheric Craig standard and local waters from underground sources and snow cover (according to F.Michel[47]): 1 – peat; 2 – ice; 3 – peat with soil; 4 – the sole of a seasonally thawed layer At the same time, isotopic fractionation occurred under nonequilibrium conditions. This is evidenced by the deuterium curve with the value of the fractionation coefficient a = 1.0130, i.e. significantly less than the equilibrium fractionation constant 2 N under these temperature conditions (1.0206). Although the values of δ18 O approach the equilibrium curve (a = 1.0028), which should indicate that the fractionation of oxygen isotopes in a closed system occurred under equilibrium conditions or close to them. The different fractionation of 18 O and 2 H in the freezing process is most likely a consequence of the imbalance of the freezing and ice formation process. The entire ice contains large, vertical column-shaped ice crystals, indicating the horizontal position of the freezing front. Obviously, the ice core was formed by freezing from top to bottom, as a result of one single cycle of prolonged freezing without loss of water. The graph in Fig. 20, B, based on the values of δ18 O and δ2 H of the seasonal heave hill formed from local groundwater, crosses the global line of meteoric waters. The upper layers of ice are located on the graph on the right, the lower ones on the left, and the distance between the points gradually increases, especially in the lower half of the graph. This most likely also indicates the existence of a single freezing cycle in a closed system without water leakage. It is well known [39] that if the freezing rate of water exceeds 2 mm/h, or if the residual water has not been intensively mixed during the freezing process, then equilibrium conditions are not reached, and noticeable isotopic fractionation occurs. At a freezing rate of 5 mm/h, isotopic fractionation is only about 50% of the equilibrium values. During the formation of seasonal heaving mounds in Bear Rocks, when ice forms under the horizon of frozen ground, the rate of ice formation, according to R. van Everdingen[38], was less than 2 mm/h, while it is unlikely that the remaining water was intensively mixed. In the ice of a seasonal bulge formed in the equilibrium conditions of a closed system, there is a long process of slow freezing with a constantly decreasing volume of unfrozen water or suspension. At the same time, isotopically heavier ices should be formed first, and at the final stage of freezing, the lightest ices (significantly lighter than the source water) should be formed. The freezing process in such a closed system can be described by the Rayleigh distillation equation. The average isotopic composition of most of the ice formed in a closed system, however, is equal to the isotopic composition of the source water. Strictly speaking, during the formation of a segregation or injection-segregation lens of ice in a closed system, the isotopic depletion of the remaining water (and ice formed from it) at the very final stage of freezing may be lighter than the source water by 10% and even 20%.[34] The average values of δ18 O, δ2 H and 3 H for ice samples of heave mounds in the North Fork Pass area are -22.5, -171 and 149 TE, respectively, and are close to the values obtained for local groundwater, i.e. the composition of groundwater is similar to the composition of waters flowing from sources and forming ice mounds heaving[38]. However, the formation of bulges does not always occur during one cycle. Thus, the results of field observations conducted by R. van Everdingen[38] and automatic time-lapse photography of seasonal heave mounds in Bear Rocks indicate that some of them can rupture, dry out and re-form during a single cycle of their development. Such events are reflected in the isotope curves of ice by abrupt transitions to values of isotopic composition less negative than for groundwater, accompanied by progressive depletion of isotopes with depth (see Fig. 19, a). Based on the study of the isotopic composition of water and ice, R. van Everdingen suggested a scheme for the development of seasonal heave mounds. At the first stage, at the beginning of winter, freezing quickly covers the water-saturated active layer, reducing the permeability of rocks and heat reserves and limiting the movement of water; freezing of water sources also leads to the formation of ice on the surface. Further freezing of the soil and the formation of ice can lead to freezing of the discharge sites of the sources and to an increase in hydraulic potential, which contributes to the bulging of seasonally frozen soil and the ice covering it. The real uplift will occur at a point or at several points where there will be the most favorable combination of relatively low resistance of frozen soils to deformation and relatively rapid water intake. Such sites are located primarily on the discharge channels of the sources. It is possible that the distribution of seasonal heave mounds in the Bear Rocks reflects the existence of a system of small taliks, from which a small amount of water flows upwards. The water that has penetrated into the heaving mound freezes gradually from top to bottom, forming pure ice. Since the heave rate can be very high and reaches 0.55 m/day (this unprecedented heave rate was directly established by R. van Everdirgen through continuous photography of seasonal heave mounds in the valley of the Bear River - van Everdingen [38, p. 254], there is often a rupture of the overlapping frozen soil.
A comparison of isotope data obtained from the ice of the Bear Rock heave mounds and the North Fork Pass area shows similar values of δ18 O and δ2 H and approximately the same range of variations in isotopic composition (Fig. 21). Thus, in the ice of the heave mounds in the Bear Rocks, the values of δ18 O varied from -22 to -27.5, in the ice of the heave mounds in the North Fork Pass area – from -21 to -26.5, the values of δ2 H – from -130 to -180 and from -160 to -200, respectively. Thus, the variations of δ18 O were about 5.5%, and δ2 H – 40-50%. This reflects both the close average annual isotopic composition of groundwater (and, accordingly, precipitation) and the conditions of the closed system in which they were formed. Isotopic data obtained by R.van Everdingen[38] and F.Michael[47] showed that the source of the formation of ice cores of the seasonal heave mounds they studied is local groundwater replenished by atmospheric precipitation, while it takes from 5 to 15 years for groundwater to reach the discharge area. Isotopic composition of ice of seasonal heaving mounds in the Charskaya basin The range and vertical distribution of the values of δ 2 H and δ 18 O of the ice of seasonal heave mounds. In the seasonal heave mounds studied in the Charskaya basin, the variations in the values of the isotopic composition ranged from 2.5 to almost 4% for the values of δ18 O and from 15 to 23% for the values of δ2 N. At the same time, for the Chara 1 hillock, a gradual decrease in the values of the isotopic composition with a depth (Fig. 21) was noted from -16.6 to -19.1% for δ18 O and from -129.3 to -144% for δ2 N; for the Chara 2 hillock, a decrease in values from top to bottom to a depth of 20-25 cm was noted - from -16.7 to -18.2% for δ18 O and from -129.9 to -139.3% for δ2 N, in the lower 7-10 cm part of the ice there was a sharp increase in values to -15.4% for δ18 O and to -122.6% for δ2 N (Fig. 21). In the ice sampled horizontally, very close values of the isotopic composition were obtained, which indicates an almost horizontal freezing of the ice layers.  Fig. 21. Distribution of the values of δ 2 H and δ 18 O of the ice of seasonal heave mounds in the Charskaya basin: a – mound 1, b – mound 2 The ratio of the values δ 2 H and δ 18 O of the ice of seasonal heave mounds. In the joint diagram δ 2 H and δ 18 O, the points of the seasonal mounds of the Charskaya basin form lines with an inclination of 5.82 (mound 1) and 5.95 (mound 2); the slopes of these lines are noticeably lower than the GLMV (Fig. 22). Such values of the slope of the lines of the ratio δ 2 H-δ 18 O in the ice of the mounds reflect freezing in a closed system, because it is known that ice forming in a closed system is usually characterized by a slope of the line δ 2 H-δ 18 O less than 7.3. This may also reflect the composition of the source water and show the effect of evaporation on its isotopic composition. In Fig. 22 it can be seen that the points of the isotopic composition of the Chara and Berkakit rivers also lie on the line of the isotopic composition of the hills, and not on the GLMV. It is possible that river water and shallow groundwater are affected by evaporation during the hot summer months in a sharply continental climate.  Fig. 22. Diagrams of the ratio of the values of δ 2 H and δ 18 O of the ice of seasonal heave mounds in the Charskaya basin Comparison of isotope curves on the ice of the heave mounds shows a progressive decrease in the content of heavy isotopes with depth, which indicates a reduction in the volume of remaining unfrozen water during its freezing in an almost ideal closed system. A constant, without noticeable jumps, decrease in the content of heavy isotopes during freezing indicates that the fractionation process was not interrupted during the entire freezing cycle (Fig. 23, b, c), i.e. heaving mounds can form during one freezing cycle, while the movement of the freezing front having a horizontal or slightly convex position, it happens from top to bottom. Sharp shifts in the isotope curves towards more positive values (Fig. 23, a, d) indicate a possible interruption and re-formation of heaving mounds during winter. For Hillock 2 in the valley of the Chara River, the character of the isotope curve (the lowest values in the central part of the ice core and higher in the upper and lower parts) may indicate bilateral freezing – from above and below – of a closed volume of water.
The isotopic composition of the source water from which the heaving mounds were formed in the valley of the Chara River can be determined based on the isotopic composition of the ice in the upper part of the mounds, assuming that freezing occurred from top to bottom. It is known that when water freezes in a closed system, the first portions of ice are isotopically heavier than water by 1.5-2% in terms of δ18 O values during rapid freezing and 2-3% in terms of δ18 O values during slow freezing, which is due to different isotope fractionation coefficients at different rates of water transition to ice [34,38,47]. The ice in the upper part of the hills has values of δ18 O -16.6, -17 (see Table. 3), most likely, freezing occurred quite quickly in conditions of low winter air temperatures, therefore, the isotopic shift with the source water most likely did not exceed 2%, i.e. it could have a value of δ18 About about -18, -19% (see Table 3, Fig. 22), which is close to the values obtained for the Chara and Berkakit rivers.  Fig. 23. Comparison of isotope curves on the ice of seasonal heaving mounds studied in different areas of the cryolithozone: northern Canada: a, b – the Bear Rocks area (according to R.van Everdingen[38]), in the North Fork Pass area (according to F.Michel[47]); Chukotka: Mr.Chulkhevey (according to Yu.K.Vasilchuk[34]); Dr. Chara, hillock 1; e – R. Chara, hillock 2; the tracks show a common trend for all hills of decreasing values of isotopic composition with depth Comparison of isotope curves on the ice of the heave mounds shows a progressive decrease in the content of heavy isotopes with depth, which indicates a reduction in the volume of remaining unfrozen water during its freezing in an almost ideal closed system. A constant, without noticeable jumps, decrease in the content of heavy isotopes during freezing indicates that the fractionation process was not interrupted during the entire freezing cycle (Fig. 23, b, c), i.e. heaving mounds can form during one freezing cycle, while the movement of the freezing front having a horizontal or slightly convex position, it happens from top to bottom. Sharp shifts in the isotope curves towards more positive values (Fig. 23, a, d) indicate a possible interruption and re-formation of heaving mounds during winter. Conclusions The study of the isotopic composition of the ice of seasonal heave mounds allowed us to establish that: - Seasonal heaving mounds are widely developed in the Charskaya basin, the height of which varies from 1 to 3-5 (and sometimes more than meters) with an ice core, with a thickness from 1 to 3 m, with a diameter from 1-2 to 10-15 meters or more. In some years in spring and early summer, during the maximum heaving, the sizes of annual heaving mounds here reach 10 m in height and from 20 to 100 m across.
- Seasonal heaving mounds are formed mainly due to the freezing of the waterlogged seasonally thawed layer (STS) from top to bottom, but sometimes part of the ice freezes from bottom to top with the counter freezing of rocks at the lower boundary of the STS.
- The direction and conditions of freezing are recorded in the isotopic record: and the isotopic composition of the ice of seasonal heave mounds is facilitated (i.e., the values of δ 18 O and δ 2 N decrease) with depth – for hill 1, this decrease was 2.5 and 15% for the values of δ 18 O and δ 2 N, respectively. For hill 2, a decrease in the values of δ18 O and δ2 N was found by 1.5 and 10%, respectively, for most of the ice core, however, in the lower part there was a sharp increase in the values of δ18 O and δ2 N by 2.8 and 17% (due to freezing from below), respectively.
- The slopes of the lines of the ratio δ 2 H-δ 18 O for ice mounds are 5.82 (hillock 1) and 5.95 (hillock 2). A decrease in the values of the isotopic composition of ice mounds with depth and the slope of the line of the ratio δ 2 H-δ 18 O less than 7.3 indicates freezing of water in a closed system, during one cycle, without moisture inflow. The distribution of isotopic values in the ice of hillock 2 may indicate simultaneous bilateral freezing of the water volume.
- The source of water for the formation of seasonal heave mounds could be shallow waters, most likely a seasonally thawed layer, with a value of δ18 O before freezing about -18, -19. Similar values were obtained for the Chara and Berkakit rivers in the research area.
- In the ice layers sampled horizontally, very close values of isotopic composition were obtained (for example, in hill 1 with values of δ18 O from -17.51 to -17.32%), which indicates consistent horizontal freezing of the ice layers.
- A comparison of the isotope curves on the ice of seasonal heaving mounds in the Char with seasonal mounds studied in different areas of the cryolithozone shows a similar distribution of isotopic composition values characteristic of freezing in a closed system.
- The cyclical nature of the isotope curve (as, for example, for the seasonal heaving mound studied in the valley of the Chulkhevey River in Chukotka) may reflect several cycles of new water intake and repeated freezing
Thanks The authors are grateful to V.G. Podgorbunsky and Yu.V. Stanilovskaya for the materials provided.
References
1. Ponomareva, O.E. (2005). Monitoring the dynamics of the surface of heaving mounds along the route of the Nadym-Punga gas pipeline (northern taiga of Western Siberia). In Materials of the third conference of geocryologists of Russia. Lomonosov Moscow State University, June 1–3, 2005. Vol. 2. Part 3. Dynamic geocryology. Publishing house Moscow. Univ. (pp. 141–146).
2. Moskalenko, N.G., Ponomareva, O.E., Ustinova, E.V. (2007). Monitoring of exogenous geological processes along the Nadym-Punga gas pipeline route. Engineering surveys, 1, 34–36.
3. Brushkov, A.V., Drozdov, D.S., Dubrovin, V.A., Zheleznyak, M.N., Sadurtdinov, M.R., Sergeev, D.O., Osokin, A.B. (2022). Principles of organizing state monitoring of permafrost. In Materials of the Sixth Conf. geocryologists of Russia “Monitoring in the permafrost zone” (June 14–17, 2022, Moscow, Lomonosov Moscow State University, geological department). (pp. 5–11). Moscow: KDU, 2022.
4. Shesternev, D.M. (2009). Permafrost zone, climate and economic development of Transbaikalia. Science in Siberia, 45(2730).
5. Shesternev, D.M., Shesternev, D.D. (2007). Heaving of coarse-grained rocks of the Chita-Ingonda depression in connection with climate warming. Cryosphere of the Earth. Vol. XI. No. 4. pp. 80–92. (in Russian).
6. Aleksandrov, A.S., Zheleznyak, I.I., Mosenkis, & Yu.M. (1990). Engineering development of the permafrost zone of Transbaikalia. Nauka. Sib. department.
7. Vtyurina, E.A. (1962). Geocryological phenomena and the relief forms they create in the South-Eastern Transbaikalia. In Proceedings of the Institute of Permafrost Science. Volume 18. Moscow: (pp. 17–25).
8. Baranov, I.Ya. (1940). Southern edge of the permafrost region. In Hydrogeology of the USSR. Moscow -Leningrad., Gosgeoltekhizdat, Vol. 17, East. Siberia. Book. 2.
9. Vasilchuk, Yu.K., Budantseva, N.A., Vasilchuk, A.C., Chizhova Ju.N., Stanilovskaya Ju.V. (2014). Migration heaving mounds in the permafrost zone of Eastern Siberia and the Far East. Engineering Geology, 1, 40–64.
10. Laperdin, V.K., Kachura, R.A. (2009). Cryogenic hazards in the zone of linear natural-technical complexes in the south of Eastern Siberia. Cryosphere of the Earth, XIII(2), 27–34.
11. Geological map of the USSR, scale 1:200,000. Ser. Bodaybinskaya. Sheet O-50-XXIX. (1984). Explanatory letter. Moscow: Ministry of Geosciences of the USSR, Ed. "Aerogeology".
12. Atlas of Transbaikalia (Buryat ASSR and Chita region). (1967). Moscow-Irkutsk: GUGK.
13. Natural conditions for the development of the north of the Chita region. (1962). Moscow: Publishing House of the USSR Academy of Sciences, M-117V.
14. Geocryology of the USSR. Eastern Siberia and the Far East (1989). E.D. Ershov (Ed.). Moscow: Nedra.
15. Sergeev, D.O., &Chesnokova, I.V. (2016). Identification of the nature of heat exchange in the seasonal thawing layer according to the data of regime thermometric observations (Chara, northern Transbaikalia). In Materials of the fifth conference of geocryologists of Russia (Moscow State University, Moscow, June 14–17, 2016).
16. Zheleznyak, M.N., Zhidin, V.I., & Serikov, S.I. (2014). Geocryological conditions of the Olekmo-Chara uplift in the zone of designed linear structures on the Ikabekan-Tarynnakh section. Modern problems of science and education, 6, 1675.
17. Kalinicheva, S.V. (2018). Identification and mapping of permafrost using satellite images in the mountainous regions of cryolithozone (on the example of the Elkon mountain and Olekmo-Charsky highlands in Southern Yakutia). In: Deline P., Bodin X. and Ravanel L. (Eds.) (2018): 5 th European Conference On Permafrost – Book of Abstracts, 23 June - 1 July 2018, Chamonix, France.
18. Zabolotnik, S.I., Klimovsky, I.V. (1966). Seasonal thawing and freezing of soils in the Chara Basin. Geocryological conditions of the northern Transbaikalia (pp. 162–171). Moscow: Nauka.
19. Sergeev, D.O. (1991). Formation and evolution of kurums in the goltsy mountain belt (using the example of the Udokan Range, Northern Transbaikalia). Abstract of thesis. diss. ...cand. geol.-mineral. Sci. M.: Lomonosov Moscow State University.
20. Alekseev, V.R. (2018). Kurums – a phenomenon of the cryosphere. Science and technology in Yakutia, 1(34), 72–88.
21. Ryzhov, Yu.V., & Golubtsov, V.A. (2017). Exogenous processes and soil formation in a small river basin of Western Transbaikalia in the second half of the Holocene. Geography and natural resources, 3, 87–96. doi:10.21782/GIPR0206-1619-2017-3(87-96)
22. Konnov, V.I. (2017). Ice formation and soil heaving on road sections in Transbaikalia. In International. scientific-practical conf. “Technosphere security of the Baikal region” (September 1–18, 2017, Chita - Alkhanay Park) (pp. 37–43). Chita: ZabSU Publishing House.
23. Chara weather station: Chara climate; Chronicle of weather in Chara. [Electronic resource]. The database contains weather observation data at a weather station in the village. Chara. Access mode is open. Date of access: 05/16/2024. URL: http://www.pogodaiklimat.ru/climate/30372.htm
24. Climatic parameters of the development zone of the Baikal-Amur Mainline. (1977). Reference manual. – L.: Gidrometeoizdat.
25. Trans-Baikalia Territory. (2011). National Atlas of Soils of the Russian Federation. S.A. Shoba (ed.). M.: Publishing house "Astrel". (pp. 550–553).
26. Vasil'chuk, Yu. K., Ginzburg, A.P., Budantseva, N.A., Vasil'chuk, J.Yu. (2022). Cryogenic soils in the Chara River valley, Transbaikalia. Arctic and Antarctic, 3, 54–91. doi : 10.7256/2453-8922.2022.3.38689
27. Vasil'chuk Y.K., Ginzburg A.P. (2023). Radial differentiation of chemical composition of cryogenic soils in the Chara river valley, north of Transbaikalia. Arctic and Antarctic, 2, 115–128.
28. Ginzburg, A.P., Vasilchuk, Yu.K., Budantseva, N.A., Vasilchuk, J.Yu., Vasilchuk, A.C. (2023). Geochemistry of frozen soils in post-pyrogenic larch forests of the Chara Basin (Northern Transbaikalia). In Current problems and prospects for the development of geocryology. In Materials of the VII All-Russian Scientific Youth Geocryological Forum with international participation, dedicated to the 150th anniversary and 100th anniversary of the birth of permafrost scientists Mikhail Ivanovich Sumgin and Kirill Fabianovich Voitkovsky, Yakutsk, Russia, June 27 – July 7, 2023 Yakutsk. (pp. 52–55).
29. Neznaeva S.V. (2024). Ecological and geochemical specificity of the migration of chemical elements in the soil catenas of the Chara Basin (Trans-Baikalia Territory, Kalarsky region). In Materials of the International Scientific Conference of the XXVII Dokuchaev Young Readings “Traditions and Innovations in Soil Science”. Ed. B.F. Aparin. St. Petersburg (pp. 47–48).
30. Dansgaard, W. (1964). Stable isotopes in precipitation. Tellus, 16, 436–468.
31. Vasil’chuk, Yu.K., Vasil’chuk, A. C., Stanilovskaya, Ju.V. (2018). Early Holocene climate signals from stable isotope composition of ice wedge in the Chara Basin, Northern Transbaikalia, Russia. Geoscience Frontiers. Vol. 9. Iss. 2. P. 471–483. doi:10.1016/j.gsf.2017.04.008
32. Vasil'chuk, Yu.K., Vasil'chuk, A.C., Budantseva, N.A., Ginzburg, A.P., Tokarev, I.V., Vasil'chuk, J.Yu. (2024). Early Holocene oxygen isotope chronologies (11,267-6420 cal BP) from ice wedge at Chara, Transbaikalia. Radiocarbon, 66(2), 400-409. doi:10.1017/RDC.2024.34
33. Vasil'chuk, Yu. K. (2018). Isotope variations in the ice core of palsa and lithalsa. Arctic and Antarctic, 1, 1–49.
34. Vasil'chuk, Yu. K. (1992). Oxygen isotope composition of ground ice (application to paleogeocryological reconstructions). Volume 1, 420 pp., Volume 2, 264 pp. Theoretical Problems Department, Russian Academy of Sciences and Lomonosov Moscow University Publications, Moscow (in Russian with English contents section).
35. Pollard, W.Н., & French, Н.М. (1983). Seasonal frost mound occurrence, North Fork Pass, Ogilvie Mountains, northern Yukon, Canada. Permafrost. Fourth International Conference. Proceedings, 1, 1000–1004.
36. Pollard, W.Н., & French, Н.М. (1984). The groundwater hydraulics of seasonal frost mounds, North Fork Pass, Yukon Territory. Canadian Journal of Earth Sciences, 21, 1073–1081.
37. Pollard W.Н., & French Н.М. (1985). The internal structure and ice crystallography of seasonal frost mounds. Journal of Glaciology, 31, 157–162.
38. van Everdingen, R.О. (1982). Frost blisters of the Bear Rock Spring area near Fort Norman, N.W.Т. Arctic, 35, 243–265.
39. van Everdingen, R.О. (1978). Frost mounds at Bear Rock. near Fort Norman, Northwest Territories 1975–1976. Canadian Journal of Earth Sciences, 15, 263–276.
40. Hinkel, K. M., Peterson, K. M., Eisner, W. R., Nelson, F. E., Turner, K. M., Miller, L. L., & Outcalt, S. I. (1996). Formation of injection frost mounds over winter 1995–1996 at Barrow, Alaska. Polar Geography, 20(4), 235–248. https://doi.org/10.1080/10889379609377605
41. Golubchikov, M.Yu., Gorlova, L.G., & Perminova, E.S. (2005). Study of seasonal natural-technogenic hydrolaccolith in the Norilsk industrial region. In Materials of the third conference of geocryologists of Russia. Volume 2. Part 3. Dynamic geocryology. Moscow: Lomonosov Moscow State University (pp. 72–73).
42. Grechishchev, S.E., & Sheshin, Yu.B. (2000). Development of some cryogenic physical and geological processes in the foundations of northern airfields. Journal of Geocryology, 2.
43. Morse, P.D., & Burn, C.R. (2014). Perennial frost blisters of the outer Mackenzie Delta, western Arctic coast, Canada. Earth Surf. Process. Land, 39(2), 200–213.
44. Paquette, M., Fortier, D., Lamoureux, S.F. (2022). Cryostratigraphical studies of ground ice formation and distribution in a High Arctic polar desert landscape, Resolute Bay, Nunavut. Canadian Journal of Earth Sciences, 59(11), 759–771. doi:10.1139/cjes-2020-0134
45. Ponti, S., Scipinotti, R., Pierattini, S., & Guglielmin, M. (2021). The Spatio-Temporal Variability of Frost Blisters in a Perennial Frozen Lake along the Antarctic Coast as Indicator of the Groundwater Supply. Remote Sensing, 13(3), 435. doi:10.3390/rs13030435
46. Mackay, J.R. (1983). Oxygen isotope variations in permafrost, Tuktoyaktuk Peninsula area, Northwest Territories. In Geological Survey of Canada. Current Research. Part B. Paper 83–1B. (pp. 67–74).
47. Michel, F.A. (1986). Isotope geochemistry of frost-blister ice, North Fork Pass, Yukon, Canada. Canadian Journal of Earth Sciences, 23(4), 543–549.
48. Froehlich, W., & Slupik, J. (1978). Frost mounds as indicators of water transmission zones in the active layer of permafrost during the winter season (Khangai Mts., Mongolia). In Permafrost. Third International Conference. Proceedings. National Research Council of Canada, 1, 189–193.
49. Yoshikawa, K. (1998). The groundwater hydraulics open system pingos. In Permafrost. Seventh International Conference, Proceedings. Yellowknife, 23–27 June 1998, Eds. A.G. Lewkowicz and M.Allard. Universite Laval. Collection Nordicana, 57, 1177–1184.
Peer Review
Peer reviewers' evaluations remain confidential and are not disclosed to the public. Only external reviews, authorized for publication by the article's author(s), are made public. Typically, these final reviews are conducted after the manuscript's revision. Adhering to our double-blind review policy, the reviewer's identity is kept confidential.
The list of publisher reviewers can be found here.
The subject of the study is, in the author's opinion, a detailed study of the isotopic composition of ice lenses in the core of seasonal heave mounds in the Charskaya basin, identification of the direction and conditions of freezing recorded in the isotope record, establishment of the isotopic composition of the water from which ice lenses were formed in the core of seasonal heave mounds and comparison of isotope curves on the ice of seasonal heave mounds in the Char with isotopic data from the ice of seasonal mounds studied in different areas of the cryolithozone of Russia and Canada. Research methodology based on the analysis of the article, it can be concluded that the Picarro L 2130-i laser infrared spectrometer is used to measure the isotopic composition of oxygen and hydrogen of ice in the Resource Center "X-ray Diffraction Research Methods" of the Scientific Park of St. Petersburg State University based on international standards, determination of radiocarbon age by liquid scintillation, layered descriptions of the structure of the studied bulges the northwestern part of the Charsky Sands sandy massif in the course of field research. The author also used the method of literary analysis, comparative characteristics of objects and processes of algorithmic and mathematical modeling. The relevance of the topic raised is due to the fact that the study of cryogenic heaving of soils, expressed in an increase in the volume of soil due to the freezing of gravitational moisture contained in it, can cause significant damage due to the activation of numerous exogenous geological processes associated with ice extraction and the flow of stone glaciers, waterlogging, thermokarst and thermal erosion. The author filled this gap. The scientific novelty lies in the fact that the author of the article, based on the conducted studies of the isotopic composition of the ice of seasonal heave mounds, established that the comparison of isotopic curves on the ice of seasonal heave mounds in the Char with seasonal mounds shows a similar distribution of isotopic composition values characteristic of freezing in a closed system, and the cyclical nature of the isotope curve may reflect several cycles of receipt of new portions of water and repeated freezing. The author recorded the direction and conditions of freezing in the isotopic record of the ice composition of seasonal heave mounds, the source of water for the formation of which may be shallow seasonally-thawed water layers. Seasonal heaving mounds are formed mainly due to the freezing of the waterlogged seasonally thawed layer from top to bottom, but sometimes part of the ice freezes from bottom to top when the rocks are frozen on the lower boundary. Style, structure, content the style of presentation of the results is quite scientific. The article is provided with rich illustrative material, drawings, photographs and diagrams are illustrative and appropriate. The bibliography is very comprehensive for the formulation of the issue under consideration. The appeal to the opponents is presented in identifying the problem at the level of available information obtained by the author as a result of the analysis. Conclusions, the interest of the readership in the conclusions there are generalizations that allow us to apply the results obtained. The target group of information consumers is not specified in the article.
|

 Eng
Eng


