|
Software systems and computational methods
Reference:
Malakhov, S.V., Yakupov, D.O. (2024). Investigation of stochastic models of packet generation in computer networks. Software systems and computational methods, 2, 53–72. https://doi.org/10.7256/2454-0714.2024.2.70340
Investigation of stochastic models of packet generation in computer networks
Malakhov Sergei Valer'evich
ORCID: 0009-0001-8666-6713
PhD in Technical Science
Assistant, Associate professor, Povolzhskiy State University of Telecommunications and Informatics
443090, Russia, Samara region, Samara, Moskovskoe shosse, 77

|
s.malakhov@psuti.ru
|
|
 |
|
Yakupov Denis Olegovich
ORCID: 0009-0003-2371-0822
Assistant, Povolzhskiy State University of Telecommunications and Informatics
443090, Russia, Samara region, Samara, Moskovskoe shosse, 77
|
|
d.yakupov@psuti.ru
|
|
|
|
DOI: 10.7256/2454-0714.2024.2.70340
EDN: EKXYBU
Received:
02-04-2024
Published:
02-06-2024
Abstract:
Stochastic packet generation models are models that are used to generate traffic in computer networks with certain characteristics. These models can be used to simulate network activity and test network performance. Standard data transmission on the network is packet generation with delays, in which packets are sent at certain intervals. Various stochastic models can be used to generate delayed packets, including uniform distribution, exponential distribution, and Erlang distribution. In this work, an experimental setup was assembled and a client-server application was developed to conduct research and analyze the performance of the data transmission channel. An algorithm has been proposed that allows to restore the moment characteristics of a random value of the interval between packets for further use of queuing models. The analysis of the distribution laws on the performance of the experimental network sample was performed and estimates of the efficiency of channel use and the average packet generation time in network segments, as well as histograms of delays according to the distribution laws, were obtained. An experimental setup was created, and a client-server application was developed to analyze the performance of the data transmission channel. An algorithm for restoring the moment characteristics of the time intervals between packets is proposed. The analysis of the distribution laws on network performance was carried out, estimates of the efficiency of channel use and the average packet generation time in network segments were obtained, as well as histograms of delays according to the distribution laws. The generation of packets with delays according to stochastic distribution laws (uniform, exponential, Erlang) is of great importance in modeling and analyzing the operation of network systems. Also, the generation of packets with delays according to the above-mentioned distribution laws allows testing and debugging of network applications and devices in conditions close to real ones. This allows to identify possible problems and improve the operation of network systems. As a result of the experiment, an algorithm was proposed that allows to restore the moment characteristics of a random value of the interval between packets for further use of queuing models. Also, the analysis of the influence of distribution laws on the performance of the experimental network sample was performed and estimates of the efficiency of channel use and the average packet generation time in network segments, as well as histograms of delays according to distribution laws, were obtained.
Keywords:
uniform distribution, exponential distribution, Erlang distribution, packet switching, delays, client-server application, traffic analysis, data transmission, generating packages, Stochastic models
This article is automatically translated.
You can find original text of the article here.
Introduction Packet generation is the process of creating and sending data packets over a network. This is an important function that is used in modern computer networks to transfer information between devices. Packet generation is carried out by software that allows you to create and send data packets with specified parameters. Packet generation in computer networks allows you to solve the following tasks: - · Network testing: Packet generation can help check network performance and identify problems such as low bandwidth and delays;
- · Security testing: Packet generation can help verify network protection against malware, hacker attacks and unauthorized access to data;
- · Performance testing: Packet generation can help you evaluate network performance and determine its bandwidth;
- · Testing new applications: Generating packages can help test the performance of new applications on the network and identify possible problems;
- · Network setup testing: Packet generation can help verify that the network is configured correctly and identify possible configuration errors.
The purpose of packet generation is to ensure efficient data transmission on the network. This is achieved by splitting large amounts of data into smaller blocks that can be transmitted over the network more quickly and reliably. In addition, packet generation allows you to manage the flow of data and monitor the quality of service on the network. The advantages of packet generation include high data transfer rates, efficient use of network resources, and the ability to ensure the reliability and security of data transmission. Packet generation also allows you to optimize your network infrastructure and improve the performance of network applications. The initial moment and the kurtosis are two main characteristics that can be used to describe the distribution of traffic in the network [1]. The initial moment is a numerical characteristic that describes the distribution of data relative to their average value. The initial moment of the first order is zero, and the initial moment of the second order is equal to the variance of a random variable. In the context of network traffic, the initial moment can be used to describe the distribution of the volume or duration of packets in traffic. For example, the second-order initial moment can be used to determine the variance of packet sizes in traffic. Kurtosis is a numerical characteristic that describes the shape of the data distribution. The kurtosis can be positive, negative, or zero. A positive kurtosis means that the distribution has heavier tails and a higher peak than the normal distribution. A negative kurtosis means that the distribution has lighter tails and a lower peak than the normal distribution. An excess of zero means that the distribution has the form of a normal distribution. In the context of network traffic, kurtosis can be used to describe the shape of packet size distribution in traffic. For example, a positive kurtosis may indicate the presence of heavy tails in the distribution of packet sizes, which may indicate the presence of large packets or unusual events in traffic. A negative kurtosis may indicate the presence of light tails in the distribution of packet sizes, which may mean the absence of large packets and uniformity of traffic. In addition, the initial moment and kurtosis can be used to compare different types of traffic or different network devices. For example, an analysis of the initial moment and kurtosis can help in comparing traffic passing through different routers or switches. This can help identify performance issues with network devices or determine the optimal network configuration. Problem statement In the modern world, computer networks play a key role in the transmission and processing of information. One of the important tasks in the design and optimization of such networks is traffic modeling, in particular, the generation of data packets. Stochastic packet generation models are one of the most commonly used approaches to solve this problem. However, existing models do not always adequately reflect the actual conditions of data transmission in computer networks, which leads to inaccuracies in forecasting and optimizing network parameters. The purpose of this work is to study stochastic models of packet generation in computer networks based on uniform, exponential and Erlang distribution. Theoretical and experimental analysis of these models will be carried out, as well as a comparison of their accuracy and efficiency in modeling real traffic. A uniform distribution is a probability distribution in which all values in a given range have the same probability of occurrence. In other words, each value in this range has the same probability of being selected. For example, if a random number from 1 to 6 is generated with a uniform distribution, then each number from 1 to 6 will have a 1/6 probability of being selected. Uniform distribution is widely used in various fields, including statistics, physics, economics, engineering, computer science and many others. It is one of the simplest and most understandable types of probability distribution, and therefore is often used as a model of a random process. The uniform distribution can be discrete or continuous. In the case of a continuous uniform distribution, all values in a certain interval are equally probable and the distribution is given by the formula f(x) = 1/(b-a), where a and b are the ends of the interval, and f(x) is the probability density at point x. Uniform distribution can also be used to generate pseudorandom numbers, which are used in computer applications to generate random sequences. A uniform distribution has several properties that can be useful in its analysis or use in modeling. Some of these properties include: - · the mathematical expectation of a uniform distribution is equal to the average of all possible values in a given range. For a continuous uniform distribution, this will be equal to (a+b)/2, where a and b are the ends of the interval;
- · the variance of the uniform distribution is determined by the formula (b-a)^2/12 for a continuous uniform distribution;
- · A histogram of uniform distribution will have a rectangular shape if the range of values is evenly divided into several intervals.
Uniform distribution can also be used to solve various problems, such as determining the probability that a random variable will fall within a certain range of values, or to find optimal values in optimization problems. To generate packets using uniform distribution, the following steps must be performed: - Determine the interval in which evenly distributed time will be generated between consecutive packets.
- Using a random number generator, generate random values with a uniform distribution in a given interval. These random values will represent the time between consecutive packets being sent to the network.
- Repeat step 2 to generate the required number of packets.
- It is important to keep in mind that the time between sending packets should be longer than the packet transmission time in order to avoid collisions and packet leaks in the network.
An exponential distribution is a statistical probability distribution that describes the time between two consecutive events in a Poisson process. For example, the time between receiving two data packets in computer networks can be described by an exponential distribution.
The main properties of the exponential distribution: - · it has a single parameter, which is called the scale parameter (usually denoted as ?);
- · the probability density function of the exponential distribution has the form f(x) = ? * exp(-?x), where x is the time between two events. This function shows the probability that the time between two events will not exceed the specified value of x.;
- · exponential distribution is a memory-free distribution, that is, the probability of an event occurring does not depend on how much time has passed since the previous event;
- · the average time between two events in an exponential distribution, i.e. the mathematical expectation is 1/?, and the variance is 1/?^2;
Exponential distribution has the property of having no memory. This means that the probability of an event occurring at any given time does not depend on how much time has passed since the previous event. For example, if the average time between two calls in a call center is 5 minutes, then the probability that the next call will occur within the next minute is 1/5, regardless of how much time has passed since the previous call. It is worth noting that the exponential distribution is one of the main distributions used in statistical data analysis, and its properties can be used to evaluate the parameters of other distributions and to test statistical hypotheses. To generate packets using exponential distribution, follow these steps: - Determine the parameter ? of the exponential distribution, which describes the average time between two consecutive events.
- Using a random number generator [2], generate random values with an exponential distribution with the parameter ?. These random values will represent the time between consecutive packets being sent to the network.
- Repeat step 2 to generate the required number of packets.
- It is important to keep in mind that the time between sending packets should be longer than the packet transmission time in order to avoid collisions and packet leaks in the network.
The Erlang distribution is a mathematical model used to describe the time between two consecutive events in the Poisson process [3]. The Poisson process is a stochastic process in which random events occur independently of each other with constant intensity. The Erlang distribution determines the probability that the number of events that occurred in a fixed time interval will be equal to a given value. This distribution can be used to model the time between calls in the call center, the time between the arrival of customers in the store, or the time between two consecutive triggers of a certain event in the production process. In general, the Erlang distribution can be represented as the sum of k independent random variables, each of which has an exponential distribution with the parameter ?. The Erlang distribution is a special form of gamma distribution. The parameter k in the Erlang distribution is called the shape of the distribution, and the parameter ? is called the intensity. The mathematical expectation of the Erlang distribution is k/?, and the variance is k/? 2. There are several methods for calculating probabilities for the Erlang distribution, including the use of tables and special software packages. If the Poisson process is heterogeneous, then an Erlang distribution with variable intensity can be used. In this case, the parameter ? will depend on time. If the number of events that can occur in a fixed time interval is unlimited, then the Weibull distribution or the Pareto distribution can be used instead of the Erlang distribution. To generate packets using the Erlang distribution, the following steps must be performed: - Determine the shape and intensity of the Erlang distribution, that is, the parameters k and ?.
- Generate k independent random variables with exponential distribution using a random number generator.
- Add up the generated values to get the time between k events in the Poisson process with intensity ?.
- This time will be the time between sending consecutive packets to the network.
- Repeat steps 2-4 to generate the required number of packets.
- It is important to keep in mind that the time between sending packets should be longer than the packet transmission time in order to avoid collisions and packet leaks in the network.
Methodology and research conditions An experimental installation was assembled, consisting of a client and a server on which Wireshark incoming traffic analysis software was installed [4] (Fig. 1) 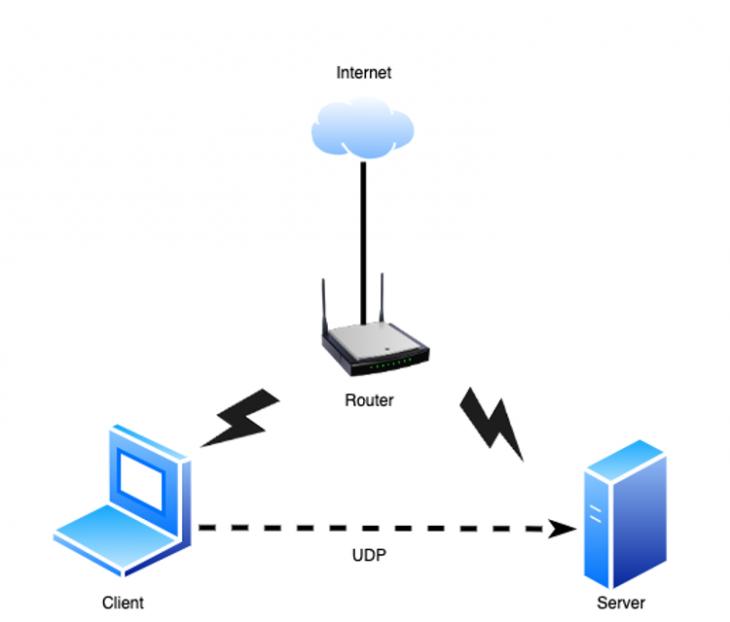 Fig. 1 – Experimental setup The experimental setup consists of: - · the client is Lenovo Ideapad 3;
- · servers – HP Pavilion G6;
- · Router - ASUS RT-AX53U;
- · the bandwidth of the channel is 100 Mbit/s.
The developed client-server application is written in the Java programming language. Program size: 774 Kbytes. No installation is required [5]. Operating system version for client and server applications: MS Windows 7-11, Mac OS X, Linux To run the application on the client and on the server, an implementation of the Java platform specification, including a compiler and class libraries (Jdk–17), installed on any operating system (Windows 7-11, Mac OS X, Linux), is required. The client generates data packets to the server (Fig. 2). The server receives the packets (Fig. 3) and analyzes the received traffic using the Wireshark program. 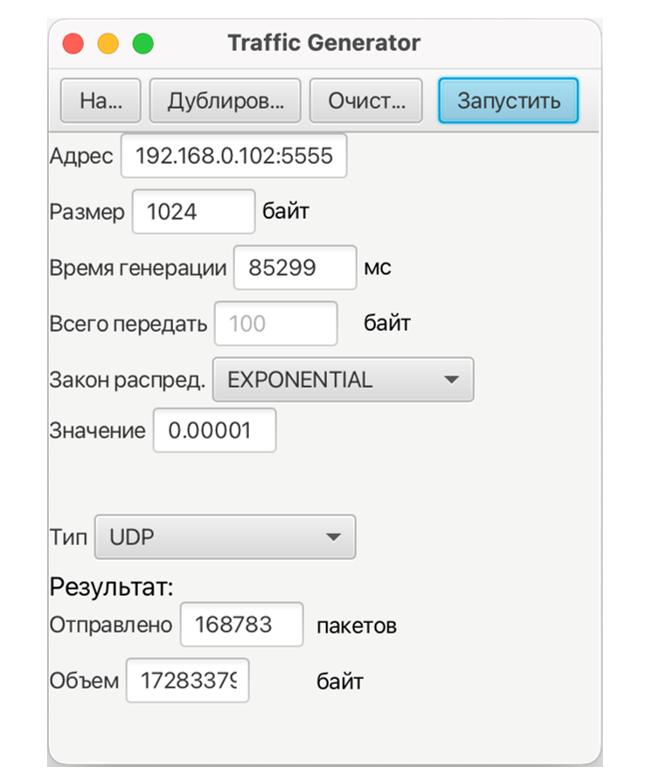 Fig. 2 – Generation of client packages with Exponential distribution In this window, the following generation parameters are specified: Server address and port, Packet size, Packet generation time, File size, Distribution law, Distribution law parameters, Traffic type. 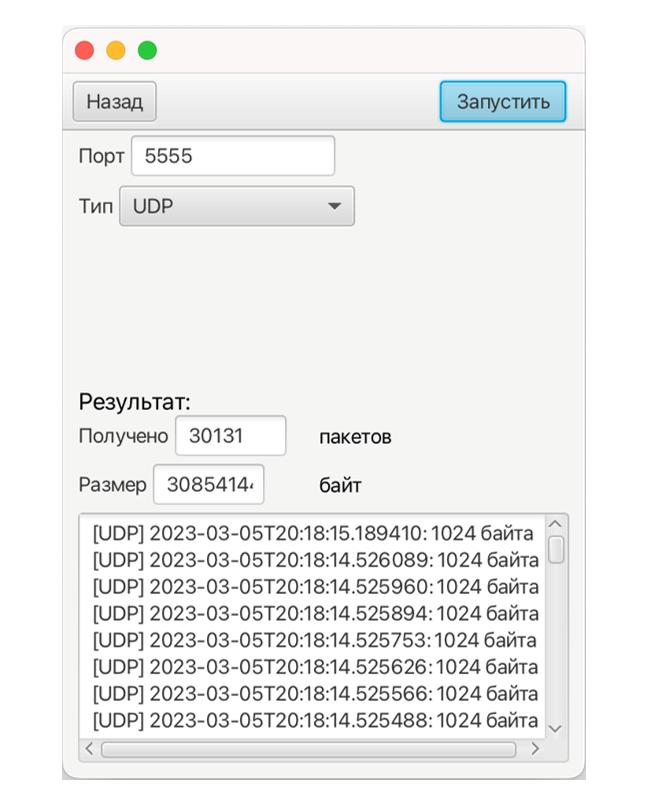 Fig. 3 – Accepting server packages In this window, the server is configured and the Port and Type of traffic are specified. The experiment consists of 3 main stages: 1. Select the distribution law for each experiment in turn (Erlang, exponential, uniform). 2. In each experiment, set the packet size (several different values). 3 different packet sizes were selected, in which the size of the payload is S (64 bytes), M (512 bytes), L (1024 bytes). 3. Packet generation takes 120 seconds (2 minutes) Results and analysis of the study Using well-known formulas of mathematical statistics, the moment characteristics of time intervals are determined. The work uses statistics up to the 3rd order, which allow us to judge the nature of the distribution of intervals. [5,6]. The average value of the interval between adjacent packets (1) is calculated to estimate the frequency of packets in the network. This allows you to determine the frequency with which packets are transmitted over the network. By evaluating this parameter, you can control the flow of data, which is important for maintaining the quality of services on the network. 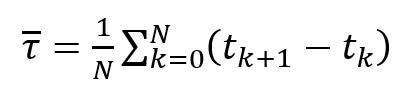 (1) (1) where are the time points of packet receipt;
N is the number of analyzed intervals. Sample variance (2) is a statistical parameter that shows how large the deviation of each element of the sample from its average value is. This indicator reflects the degree of data dispersion in the sample. This parameter is useful when analyzing data to understand how much data changes or differs. 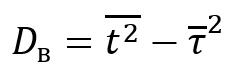 (2) (2) where is the second initial moment. The second initial moment (3) of a kind of statistical quantity is the mathematical expectation of the square of this quantity. It can be used to estimate the spread of observed values relative to zero. This is an important characteristic in the analysis of random variables, especially when using statistical modeling and forecasting. 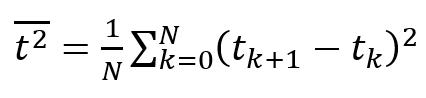 (3) (3) The coefficient of variation (4) is a statistical indicator that determines the relative variation or spread of observations in a given sample. The higher the coefficient of variation, the greater the spread of data in the sample. It is used to compare the level of variability of different data. 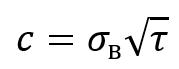 (4) (4) where is the standard deviation Asymmetry (5) is a statistical indicator that characterizes the degree of deviation of the sample distribution from the symmetrical one. This allows us to assess the asymmetry of the data distribution. If the asymmetry is positive, then the distribution is shifted to the right, if negative, to the left. The asymmetry is zero for a symmetric distribution. The calculation of asymmetry is especially important in data analysis in order to choose the right statistical approach for analysis. 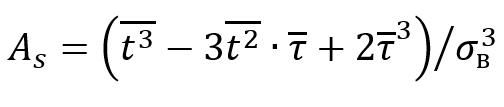 (5) (5) where is the third initial moment The third initial moment (6) is the mathematical expectation of a cube of a random variable. It is used to calculate the asymmetry coefficient, which characterizes the degree of deviation of the data distribution from the symmetric one. This parameter is needed to understand the shape of the distribution of the dataset. It provides information about whether the distribution of the dataset is skewed and, if so, in which direction. This is an important parameter when choosing a statistical approach to data analysis. 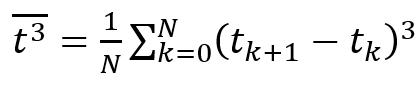 (6) (6) To calculate the moment characteristics, data from the Wireshark log files were imported into MS Excel. Packets sent from the client to the server will be taken into account. Table 1 shows the data of the developed client-server application, and Table 2 shows the data of the Netem program [7]. Table 1. Average moment characteristics of the interval between packets according to the laws of distribution using the developed client-server application | The law of distribution | Uniform | Exponential | Erlang | | | 2,1E-04 | 2,0E-04 | 1,4E-04 | | | 1,1E-07 | 2,3E-07 | 2,1E-07 | | | 4,1E-09 | 6,2E-09 | 6,8E-09 | | | 1,3E-07 | 1,9E-07 | 1,8E-07 | | | 2,2005 | 2,2192 | 3,0606 | | | ~0 | >0 | >0 | | Time(s) | 120 | Table 2. Average moment characteristics of the interval between packets according to the laws of distribution using the Netem program | The law of distribution | Uniform | Exponential | Erlang | | | 1,52E-03 | 2,19E-03 | 4,5E-02 | | | 0,8E-06 | 2,9E-07 | 2,4E-06 | | | 4,4E-09 | 5,1E-09 | 7,1E-09 | | | 0,9E-06 | 3,3E-07 | 1,9E-06 | | | 1,7955 | 2,4991 | 2,8375 | | | ~0 | >0 |
>0 | | Time(s) | 120 | | | | | | | | Based on the calculation of the average moment characteristics of the interval between packets according to the laws of distribution using the developed client-server application and the Netem program, it can be concluded that the developed application generates packets with delays more accurately according to the laws of distribution. The accuracy difference is ~14% in favor of the developed client-server application. The coefficient of variation shows the difference between traffic and the Poisson flow and, together with the asymmetry, allows us to judge the degree of weight of the tails of the distribution of intervals between packets The second initial moment shows the variance of a random variable, that is, a measure of the spread of values around the average value. The higher the value of the second initial moment, the greater the spread of values and the less predictable the packet generation process is. The smallest variation is observed in a uniform distribution. The third initial moment of a random variable shows the average value of its cube. If the initial moment 3 is not zero, then this indicates that the probabilities for values at different distances from the average value are not symmetric. For a uniform distribution, the third initial moment is the lowest. The asymmetry of a random variable shows how much its distribution differs from the symmetric one. If the asymmetry is zero, then the distribution is symmetric. If the asymmetry is greater than zero, then the distribution is skewed to the right (more values are to the right of the mean) and the distribution has a heavier right tail. For a uniform distribution, the asymmetry is almost equal to 0, for an Erlang and Exponential distribution it is greater than 0. If the coefficient of variation is greater than zero, then this indicates that the spread of values of a random variable relative to its average value is large. Thus, the higher the value of the coefficient of variation, the higher the level of variability of the random variable. In a uniform distribution, the coefficient of variation is the smallest [8,9]. Histograms of distributions were constructed based on the obtained delays. With the Erlang distribution (Fig. 4), the delay value is maximum at intervals of 336-430 ms. As the intervals increase, the delay decreases.  Fig. 4 – The resulting histogram of the Erlang distribution With an Exponential distribution (Fig. 5), the delays are maximum for short time intervals.  Fig. 5 – The resulting histogram of the Exponential distribution With a uniform distribution (Fig. 6), the delays for different intervals are 300 ms. Which is significantly worse of the above.  Fig. 6 – The resulting histogram of Uniform distribution The volume transmitted in 2 minutes for each distribution law included both useful data and service data. Depending on the packet size, the efficiency of the payload varied [10] (Fig. 7). Maximum efficiency was achieved with large packet sizes.  Figure 7 – Efficiency of the payload (S – 64 bytes, M – 512 bytes, L – 1024 bytes) During the experiment, small packet losses occurred during data transfer, on average less than 50 packets (<0.01%). In the process of generating packets from the client, incoming traffic on the server loaded the channel. Depending on the packet size and the distribution law, the load had different values (Fig. 8). With the Erlang distribution, the channel load turned out to be the largest, which indicates the greater efficiency of this model.  Figure 8 – Channel load according to the laws of distribution (S – 64 bytes, M – 512 bytes, L – 1024 bytes) It is believed that for loaded Ethernet and Fast Ethernet systems, a good value for network utilization is 30%. This value corresponds to the absence of prolonged network downtime and provides sufficient margin in case of peak load increase [11]. The traffic generated by the Erlang distribution, with a payload packet size of 1024 bytes (29.5%), became the most efficient law in terms of channel utilization. The same result confirms the average packet generation time. Depending on the size of the packet and the distribution law, the time had different values (Fig. 9) [12]. The Erlang distribution model showed the lowest average packet generation time.  Figure 9 – Average packet generation time according to distribution laws (S – 64 bytes, M – 512 bytes, L – 1024 bytes) Conclusion The generation of packets with delays according to stochastic distribution laws (uniform, exponential, Erlang) is of great importance in modeling and analyzing the operation of network systems. Also, the generation of packets with delays according to the above-mentioned distribution laws allows testing and debugging of network applications and devices in conditions close to real ones. This allows you to identify possible problems and improve the operation of network systems. As a result of the experiment, an algorithm was proposed that allows to restore the moment characteristics of a random value of the interval between packets for further use of queuing models. Also, the analysis of the influence of distribution laws on the performance of the experimental network sample was performed and estimates of the efficiency of channel use and the average packet generation time in network segments, as well as histograms of delays according to distribution laws, were obtained. The highest efficiency of the payload is observed with a packet size of 1056 bytes (1024 bytes of payload). The highest channel performance is observed when using the Erlang distribution, with a payload size of 512 bytes and 1024 bytes. Also, this fact confirms the average generation time of one packet, which shows the highest performance when distributing Erlang
References
1. Zhukova, G.N. (2015). A Map of Skewness and Kurtosis Coefficients in Teaching Probability Theory and Mathematical Statistics. Concept, 8, 1-4.
2. Dmitriev, E.I., & Medvedev, A.V. (2011). P-Exponential Random Number Generator. Actual Problems of Aviation and Astronautics, 7, 316-317.
3. Erlang distribution. (Accessed March 6, 2023). Retrieved from http://algolist.ru/maths/matstat/erlang/index.php#:~:text=%D0%A0%BC
4. How to use Wireshark for traffic analysis. (Accessed March 6, 2023). Retrieved from https://losst.pro/kak-polzovatsya-wireshark-dlya-analiza-trafika
5. Yakupov, D.O. (2023). Application for generating packets in computer networks using stochastic distribution models. Retrieved from https://elibrary.ru/item.asp?id=50133060
6. Tarasov, V.N., Bakhareva, N.F., Gorelov, G.A., & Malakhov, S.V. (2014). Analysis of incoming traffic at the level of three moments of time interval distributions. Information Technology, 9, 54-59.
7. Emulation of the influence of global networks. (Accessed May 10, 2023). Retrieved from https://habr.com/ru/articles/24046/
8. Performance Tuning Guide. (Accessed May 10, 2023). Retrieved from http://www.regatta.cs msu.su/doc/usr/share/man/info/ru_RU/a_doc_lib/aixbman/prftungd/2365c91.html
9. Ethernet/Fast Ethernet network algorithms. (Accessed May 10, 2023). Retrieved from https://intuit.ru/studi/professional_retraining/943/sources/57/lecture/1690?page=2
10. Providing data packets with accurate timestamps in network monitoring systems. (Accessed May 10, 2023). Retrieved from http://www.treatfake.ru/solutions/network-monitoring-systems/accurate-time-stamping-of-data-packets-in-network-monitoring-systems
First Peer Review
Peer reviewers' evaluations remain confidential and are not disclosed to the public. Only external reviews, authorized for publication by the article's author(s), are made public. Typically, these final reviews are conducted after the manuscript's revision. Adhering to our double-blind review policy, the reviewer's identity is kept confidential.
The list of publisher reviewers can be found here.
The subject of the study. Based on the title, the article should be devoted to the study of stochastic models of packet generation in computer networks. The content of the article corresponds to the stated topic. The research methodology includes the use of research methods such as data analysis and synthesis. It is also valuable that the author actively uses graphical tools to demonstrate the scientific results obtained. The relevance of the study of issues related to the use of stochastic models of packet generation in computer networks is beyond doubt. Solving existing problems in this direction will significantly accelerate the technological modernization of the Russian economy, thereby contributing to the achievement of the national development goals of the Russian Federation for the period up to 2030, defined in the Decree of the President of Russia dated 05/07/2024. Scientific novelty is present in the material submitted for review. In particular, it may be related to the experimental setup scheme shown in Figure 1 (provided that it is an author's development). Style, structure, content. The style of presentation is scientific. The structure of the article has not been built by the author. It is recommended to form the following structural elements when finalizing the article: "Introduction", "Problem statement", "Methodology and research conditions", "Research results", "Discussion of research results", "Conclusions and further research directions". Familiarization with the content allows us to conclude that the author is a little confused about the results obtained (which is most likely due to the lack of a clearly defined structure of the study). It is also recommended that the author add an analysis of each graphic object, because in the current version, the article contains only references in the statement format ("the figure shows something"). The reader is interested in the conclusions drawn by the authors for each graphic object. It seems advantageous to add a table to the text of the article containing a list of key author's ideas and problems to be solved when implementing these recommendations. Moreover, the author needs to carefully proofread the article for spelling and punctuation errors both in the text of the article and in the list of references. Bibliography. The bibliographic list formed by the author consists of 10 titles, of which only 2 are scientific publications. When finalizing the article, the author is recommended to expand the number of studied sources, including adding foreign scientific publications. Appeal to opponents. When finalizing the article and expanding the number of sources that are scientific publications, the author should compare the scientific results obtained with the results of research conducted by other authors in Russia and abroad. This will also enhance the scientific novelty of the research and attract additional readership. Conclusions, the interest of the readership. Taking into account all the above, we conclude that the author has chosen a research topic, scientific articles on which will be in demand among the readership. At the same time, the article needs to be finalized according to the comments indicated in the text of the review.
Second Peer Review
Peer reviewers' evaluations remain confidential and are not disclosed to the public. Only external reviews, authorized for publication by the article's author(s), are made public. Typically, these final reviews are conducted after the manuscript's revision. Adhering to our double-blind review policy, the reviewer's identity is kept confidential.
The list of publisher reviewers can be found here.
The reviewed article is devoted to the study of stochastic models of the process of creating and sending data packets through computer networks. The research methodology is based on the use of an experimental installation collected by the authors of the publication, consisting of a client and a server on which the Java programming language software for analyzing incoming Wireshark traffic was installed. The authors attribute the relevance of the work to the fact that packet generation is an important function that is used in modern computer networks to transfer information between devices by splitting large amounts of data into smaller blocks that can be transmitted over the network more quickly and reliably, in addition, it becomes possible to control the flow of data and monitor the quality of service on the network. The scientific novelty of the reviewed study: an algorithm is proposed that allows to restore the moment characteristics of a random value of the interval between packets for further use of queuing models; estimates of the efficiency of channel use and the average packet generation time in network segments, as well as delay histograms according to various distribution laws, are obtained; it is revealed that the highest channel performance is observed when using the Erlang distribution. Structurally, the following sections are highlighted in the article: Introduction, Problem statement, Methodology and research conditions, Results and analysis of the study, Conclusion and Bibliography. The authors performed an experiment according to the scheme described in the article, showed the average moment characteristics of the interval between packets according to the laws of distribution using a developed client-server application, presented the obtained histograms of the Erlang distribution, exponential and uniform distributions, reflected the effectiveness of useful data. It is noted that the highest efficiency of the payload is observed with a packet size of 1056 bytes (1024 bytes of payload), the highest channel performance is observed when using an Erlang distribution with a payload size of 512 bytes and 1024 bytes. The bibliographic list includes 10 sources – electronic Internet resources and scientific publications of Russian scientists on the topic under consideration. The text of the publication contains targeted references to the list of references confirming the existence of an appeal to opponents. Among the shortcomings of the publication that need to be eliminated, it is worth noting that formulas 1-6 are not reflected in the text of the article posted in the publishing house's information system – this makes it impossible to assess their semantic content. In addition, there are no deciphers of the symbols in Figures 7, 8 and 9, as well as the axis signatures in Figures 4, 5 and 6. The reviewed material corresponds to the direction of the journal "Software Systems and Computational Methods", reflects the results of the author's research, may arouse interest among readers, may be recommended for publication after revision in accordance with with a comment made.
Third Peer Review
Peer reviewers' evaluations remain confidential and are not disclosed to the public. Only external reviews, authorized for publication by the article's author(s), are made public. Typically, these final reviews are conducted after the manuscript's revision. Adhering to our double-blind review policy, the reviewer's identity is kept confidential.
The list of publisher reviewers can be found here.
The article examines stochastic models of packet generation in computer networks. The main focus is on comparing uniform, exponential distributions and Erlang distributions in the context of their accuracy and efficiency in modeling real network traffic. The research methodology includes a theoretical analysis of the selected stochastic models and their experimental verification using a client-server installation. The use of Wireshark software for analyzing incoming traffic allows you to evaluate in detail the characteristics of the generated packets. The software used to generate packages is written in Java and has been tested on various operating systems, which ensures the wide applicability of the research results. The relevance of the study is justified by the importance of accurate modeling of network traffic to ensure the stability and security of computer networks. With a rapidly growing volume of data and increasingly complex network structures, accurate modeling and analysis of network traffic are critical to maintaining the efficient operation of network infrastructures. The scientific novelty of the work consists in comparing various stochastic models of packet generation and in developing a technique for more accurate modeling of real network traffic. The authors provide new data on the accuracy and effectiveness of various models, which allows for a more objective assessment of their application in real network conditions. The article is written in a clear and accessible style, with a clear structure, which facilitates the perception of the material. The introduction smoothly introduces the research topic, explaining in detail the need and importance of packet generation. The main part of the article is devoted to a detailed description of the models and experimental setup, as well as an analysis of the results obtained. The conclusion summarizes the results of the study and formulates the main conclusions. The conclusions of the article are clearly formulated and substantiated by experimental data. The authors conclude that the Erlang distribution model has shown the highest performance and accuracy in modeling real network traffic, which is confirmed by the results obtained. It is also noted that the use of this model allows you to improve network parameters and increase the efficiency of its operation. The article is of interest to a wide audience, including researchers in the field of computer networks, software developers and network security specialists. The work contributes to a deeper understanding of packet generation processes and improved methods for modeling network traffic, which is of great practical importance. I recommend accepting the article for publication, as it represents a valuable contribution to the field of research of stochastic models of packet generation in computer networks and has high scientific and practical significance. Recommendation: interdisciplinary research can significantly enrich this work. The possibility of applying stochastic packet generation models in related fields such as the Internet of Things (IoT), cloud computing and big data should be explored. Collaboration with researchers from other fields to conduct interdisciplinary research and share experiences will contribute to the development of new ideas and approaches.
|

 Eng
Eng


