|
Arctic and Antarctica
Reference:
Ianchenko (Yanchenko), N.I., Antsiferov, E.A. (2024). First results of measuring temperature in snow cover at a winter search site in Irkutsk. Arctic and Antarctica, 2, 21–32. . https://doi.org/10.7256/2453-8922.2024.2.70067
First results of measuring temperature in snow cover at a winter search site in Irkutsk
Ianchenko (Yanchenko) Natalia Ivanovna
Leading Researcher, Irkutsk National Research Technical University
664074, Russia, Irkutsk region, Irkutsk, Lermontov str., 83

|
fduecn@bk.ru
|
|
 |
|
Antsiferov Evgenii Aleksandrovich
PhD in Chemistry
Associate Professor, Department of Chemistry and Biotechnology named after V.V. Tuturina", Irkutsk National Research Technical University
83 Lermontov str., Irkutsk, Irkutsk region, 664074, Russia
|
|
antsiferov@istu.edu
|
|
 |
|
DOI: 10.7256/2453-8922.2024.2.70067
EDN: VGWBSF
Received:
06-03-2024
Published:
12-07-2024
Abstract:
The article is devoted to the first results of monitoring the temperature in the snow cover, the height of the snow cover and the atmospheric air temperature in Irkutsk. The results were obtained on the basis of exploratory scientific and organizational research that began in 2021 at the INRTU sites using an autonomous automatic software and hardware complex developed at the Institute for Monitoring Climatic and Ecological Systems of the SB RAS. It has been established that there is a change in temperature in the snow cover at the same height during the day, while in the height range from 0 to 15 cm (0 cm is the underlying base) temperature fluctuations between min and max are insignificant compared to temperature fluctuations in the upper layers snow cover. It is shown that graphically changes in temperature in the snow cover at altitudes that are closer to the atmospheric surface of the snow cover have more pronounced amplitude daily cycles, in contrast to changes at low altitudes. A linear correlation has been established between air temperature and temperature at various heights in the snow cover; the correlation coefficient decreases with decreasing heights in the snow cover, provided that the maximum height of the snow cover is constant, for example, during the day. The phenomenon of cooling of the surface of the snow cover at certain hours during the day, when the temperature of the snow-atmospheric surface is lower than the air temperature, is shown. We note that actual values obtained in autonomous automatic real-time mode, such as air temperature, temperature and snow depth, may have practical significance and over time, with the development of digitalization, may be in demand for managing the urban ecosystem of the city and/or individual territories
Keywords:
temperature, depth, snow cover, temperature profile, cooling, snow-atmospheric surface, digitalization, software and hardware complex, monitoring, Irkutsk
This article is automatically translated.
You can find original text of the article here.
Introduction Snow cover is an important component of the climatic and economic characteristics of cold regions, snow is important for ecological and climatic systems. In this regard, it is necessary to register the actual characteristics of the snow cover in time and space, i.e. monitoring. In our opinion, data on studies of snow cover characteristics such as height and temperature at different heights of snow cover on the basis and/or on the soil are still limited. It can be assumed that one of the reasons is the lack of available measuring instruments. According to O. Y. Goncharova [1], "The analysis of soil surface temperature, winter n-factors and snow cover thickness in the north of Western Siberia is further complicated by the practical absence of a network of weather stations where snow cover height and soil temperature are monitored." Traditionally, the height of the snow cover is determined at weather stations as the average value from the readings of three snow measuring rails [2]. Researchers V. V. Kalinnikov, A.V. Ustinov, N. S. Kosarev [3] evaluated the accuracy of determining the height of the snow cover using a new method of GNSS reflectometry (GNSS – global navigation satellite systems). Yu K., Ban V., Zhang S., Yu X write about the assessment of the depth of snow cover using a GPS geodetic station [4]. P. V. Bogorodsky and his co-authors write about the thermocope sensors located in the snow-ice cover and the subglacial layer [5]. A team of researchers from the Institute for Monitoring Climatic and Ecological Systems of the Siberian Branch of the Russian Academy of Sciences has proposed an autonomous measuring complex that allows estimating the height of snow cover by temperature changes at the atmosphere-snow cover boundary [6, 7] and temperature in the snow cover. The need for actual temperature values in the snow cover can be understood, for example, from the publication of N.V. Chmykh, A.M. Burgonutdinov [8], in which it was noted that in the absence of actual values of T for calculating the specific heat capacity of the snow cover, they proposed to determine T using interpolation, it is indicated that "intermediate temperature values are proposed to determine using interpolation. " Methodology and research area The measurements were made using an autonomous automatic software and hardware atmospheric-snow complex developed at the Institute for Monitoring Climatic and Ecological Systems of the Siberian Branch of the Russian Academy of Sciences [6, 7] and installed on the search sites of the Irkutsk National Research Technical University (IRNTU) in Irkutsk. In Irkutsk, the snow cover can be characterized as "boreal forest snow" if we accept snow types based on ranges of geographical coordinates in degrees of north latitude and proposed by researchers [9], i.e., "classification of snow types into three classes: boreal forest snow (47-58 ° C.), tundra snow (58-74 ° S.S.) and the snow of the polar desert (74-83 ° S.S.)...". In the first measuring season (January-April 2021), the device (part of the complex) was installed on a site approximately 200-300 m from the lower IRNIT stadium. In the second season (November 2021 - March 2022) – at the stadium of the sports and recreation base of IRNTU Polytechnic (17 km of the Baikal Tract, about 28 km from IRNTU), in the third season (October 2022 - spring 2023) and the fourth season (October 2023 - spring 2024) – at the lower stadium of IRNITU (Fig. 1). At all observation platforms, at the place of installation of the device, there was low grass (up to 5-7 cm), no influence of vehicles, buildings, trees. 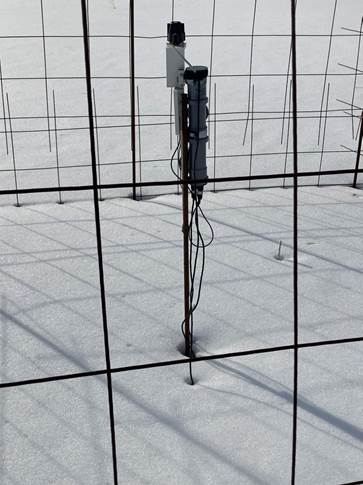
Fig.1. Autonomous automatic software and hardware atmospheric snow complex. The lower stadium of IRNITU. March 4, 2023 The complex includes a measuring rail (thermowell) 40 cm long with small-sized digital temperature sensors (17 pcs.,) located 2.5 cm in height of the thermowell, a solar panel, a controller, and remotely located computers. Part of the thermal mower at one time or another can be located in the snow cover (SP) and register T according to the height of the snow cover (step 2.5 cm), and the other part of the thermal mower (rails) can be outside the joint venture and, accordingly, register the air temperature (Fig. 2). 
Fig.2. Temperature change along the height of the rail on 02/25/2021, at the IRNITU site The measuring complex is configured to register T every hour and the results are transmitted to a remote server, i.e. 408 values during the day (24 hours*17 micro sensors = 408). The height of the snow cover (SP) is determined by a relatively sharp change in temperature T at the air-snow surface boundary, which is most noticeable at night, in this case 5 a.m. is selected. The same time is chosen in order to compare heights on different days. We note that in the fall of 2020, the clock was switched to winter time, this article indicates the actual local time. The results of the study and their discussion
Temperature changes in the snow cover In the first search season, measurements began on 01/21/2021. The period from 01/22/2021 to 03/06/2021 is characterized as a period of stable negative air temperatures, without thaws. During this period, T min air temperature = – 35.4℃ (02/01/2021), T max air temperature = 0.6 ℃ (03/06/2021), T average air temperature = – 15.9℃. Only on March 6, there was a transition of T through 0℃ and then a steady trend towards positive air temperatures began. Figures 3 (a, b, c) show the change in T in the height of the snow cover at individual hours (temperature profile in height, h ≠ const and t = const), and Figure 4 shows the change in temperature over time for three days, but at separate altitudes (temperature profile over time, h = const and t ≠ const). In the article Fierz C., [10] it is stated, "the snow temperature profile reflects the temperature distribution inside the snow cover at one point, both in space and in time." The temperature profiles of the joint venture represent, as it were, a snapshot of the temperature distribution in the joint venture. Figures 3 (a, b, c) show the actual temperature change in the height of the rail over time, but for clarity, the change in T is indicated only at individual hours, in 1, 5, 9, 13, 17, 21 an hour of one day on 01/27/2021, 02/04/2021, 03/04/2021 At night, the most dramatic temperature change occurs at the atmosphere-snow cover boundary, this can be seen by the behavior of the lines in Figure 2 (5 o'clock) and in Figures 3 (a, b, c) for 5, 9, 23 o'clock, i.e. by changing the "course" of temperatures, you can specify the actual height snow cover. It can be noted that in the range of heights from 0 to 15 cm, the fluctuations of T are insignificant compared to the fluctuations of T in the upper layers of the snow cover (Fig.3). For example, on 03/24/2021, (Fig. 3 c), at a specific height H = 0 cm, the fluctuations of T between min and max during the day amounted to minus – Δ 0.9 ℃, at a height of H = 15 cm – Δ 2 ℃, at a height of H= 17.5 cm – Δ 2.3 ℃, at a height of H = 20 cm – Δ 3.5 ℃, at a height of H= 25 cm – Δ 6.3 ℃, at a height of H = 30 cm – Δ 10.4 ℃. For example, at the mark H SP = 0 cm (the surface of the underlying base) at 3 o'clock T 3 o'clock max = – 6.6℃, at 15 o'clock T 15 o'clock min = – 5.7℃ and the difference is minus – Δ 0.9 ℃. Fierz C., describes [10] snow temperature profiles measured on February 23-24, 2000, at a research site at an altitude of 2,540 m above sea level, Davos, Switzerland. «…. These temperature profiles also clearly show that heat only slowly penetrates into the snow and that heat waves strongly attenuate with depth. Thus, below about 30 cm (maximum height 50 cm), the temperature profiles showed only low-amplitude daily cycles, which almost disappeared below." | 
| | Fig. 3 a. Temperature change in the joint venture and the atmosphere (according to the height of the rail) 27.01.2021, H max SP = 25-27.5 cm. | | 
| | Fig. 3 b. Temperature change in the joint venture and the atmosphere (according to the height of the rail) 04.02.2021, H max SP = 30-32.5 cm. | | 
| | Fig. 3 in. Temperature change in the joint venture and the atmosphere (according to the height of the rail) 4.03.2021, H max SP = 32.5-35 cm. |
V.V. Ponomarev writes about the temperature of the lower layers of the snow cover [11], he points out that "in the winter of 2017-2018, the thermal regime of the snow cover and the soil surface was studied in the Prisursky Nature Reserve.... On the surface of the soil during the winter, the temperature under the snow was about 0 °C. In the lower thickness of the snow cover (10-20 cm from the ground), the temperature in winter was 0...-6 °C, although the air temperature dropped to -20 – -25 °C" [11]. Figure 4 shows the temperature changes in the joint venture during the day of 02/13/2021 at certain altitudes 0, 5, 10, 15, 20, 25, 30 See For example, at the 0 cm mark, there was a change in T from - 5.4 °C to - 6.4 °C. At around 20 cm, T varies from - 12.6 ° C to - 14.3 ° C, at an altitude of 25 cm, T varies from - 14.3 ° C to - 17.7 ° C. The greatest T changes occur at altitudes that are closer to the surface of the snow cover. We note that there was a snowfall on these days. The relationship between air temperature, snow cover surface temperature, wind speed and clouds is indicated in the work of V. M. Kotlyakov and A.V. Sosnovsky [12], but these factors are not discussed in this publication. According to the data from March 1 to March 3, 2021, measurements of T in the joint venture at altitudes of 10,15,20 and 25 cm for three days (72 hours), a graph is plotted (Fig. 5). The countdown is 0 hours of the first day. On these days, the height of the snow cover H max = 32.5 cm. The graphs are similar to "waves", have amplitudes of changes in T at altitudes in the joint venture (Fig. 5). The greatest fluctuations in T occur during those hours when there is sunlight and in those layers of the joint venture that are either on the border or closer to the border of the atmosphere- snow cover. | 
| | Fig. 4. Temperature change in the snow cover at an altitude of 0,5,10,15,20,25,30 cm. 02/13/2021, | | 
| | Fig. 5. Temperature change in the snow cover at an altitude of 10, 15, 20, 25 cm for 72 hours. 01.03-03.03.2021. H max SP = 32.5 cm. | On the correlation of air temperature and temperature in the snow cover at altitudes Graphs of temperature changes at different heights in the snow cover and air temperature are presented separately, indicating the correlation coefficients (Fig. 6 a, b, c). Air temperature was measured at a height of 40 cm, since this is the maximum height of the thermal mower. So on 02/25/2021, the coefficient of linear correlation between T of air and T at altitudes of 35, 25, 15 cm decreases as the heights from the surface to the underlying base of the snow cover decrease (0 cm is the underlying base). The correlation coefficient between T of air and T in the snow cover at a height of 35 cm R = 0.99; between T of air and T at a height of 25 cm R = 0.72; between T of air and T at a height of 15 cm R= 0.15. According to data from March 25, 2023, a linear correlation was also established between air temperature and temperature at altitudes of 15.25 cm in the snow cover (Fig.7 a, b), the correlation coefficient decreases with decreasing heights in the snow cover from R=0.85 at H=25 cm (Fig. 7 a) to R=0.47 at H = 15 cm, while the maximum height of the joint venture is 32.5 cm constant (Fig. 7 b, Table 1). The result from 03/27/2023 is shown in Figure 8. It can also be noted that the lower the maximum height of the joint venture (Table. 1), the higher the correlation coefficient at heights of 10-15 cm (Fig. 6 c, Fig. 7 b, Fig. 8). Table 1. Correlation coefficient between T of air and T in snow cover | Date | H max, cm | R |
| H =35 cm | H =25 cm | H =10-15 cm | | 25.02.2023 | 37,5 | 0,99 | 0,72 | 0,15 | | 25.03.2023 | 32,5 | - | 0,85 | 0,47 | | 27.03.2023 | 27,5 | - | - | 0,76 |
| 
| | Figure 6a. The change in air temperature at a height of 40 cm and the temperature in the snow cover at a height of 35 cm on 02/25/2023 g. H max SP = 37.5 cm | | 
| | Figure 6 b. Change in air temperature at a height of 40 cm and temperature in the snow cover at a height of 25 cm on 02/25/2023 g. H max SP = 37.5 cm | | 
| | Figure 6 in. The change in air temperature at a height of 40 cm and the temperature in the snow cover at a height of 15 cm on 02/25/2023, H max SP = 37.5 cm | | 
| | Figure 7a. The change in air temperature at an altitude of 40 cm and the temperature in the snow cover at an altitude of 15 cm on 03/25/2023. H max SP = 32.5 cm | | 
| | Figure 7 b. Change in air temperature at a height of 40 cm and temperature in the snow cover at a height of 15 cm on 03/25/2023 H max SP = 32.5 cm | | 
| | Figure 8. Change in air temperature at a height of 40 cm and temperature in the snow cover at a height of 10 cm. 03/27/2023 H max SP = 27.5 cm | Snow cover surface temperature At certain hours during the day, if the T of the snow cover surface is lower than the T of the air, then the phenomenon of SP cooling is observed [11]. So V. V. Ponomarev [11] studied the thermal regime of snow cover and soil surface in the Prisursky Nature Reserve and notes the fact that "the snow height on April 5 was 44 cm.... With a clear sky, intensive cooling of the surface layer (upper layer of snow) occurred. According to the data, at 4 o'clock above the snow surface (4-5 cm), the air cooled to -6.4 °C, while at an altitude of 2 m the temperature was 6 degrees higher (-0.4 °C)." It was found that on 22.01.2021 the maximum height of the joint venture is 22.5 cm, 23.01.2021 N max joint venture =22.5 cm and 26.01-28.01.2021 N max joint venture = 25 cm. Fig. 9 shows the change in the temperature difference between T of air and T of the surface of the snow cover. For example, on 01/23/2023, H max SP =22.5 cm and at 8 o'clock in the morning T vzd = – 16.25℃, on the surface of the snow cover T of the snow cover = - 18.17℃, Δ =1.9℃ (Fig. 9). The air temperature was measured at a height of 40 cm, this is the maximum height of the thermal mower. Figure 9 shows that at certain hours during the day, the surface of the snow cover is colder than the air and the graph lines are located above the abscissa axis. The course of the curves (Fig. 9) has its own characteristics associated not only with changes in atmospheric air temperature, but also other factors such as snow precipitation, wind speed, solar radiation, etc., which are not considered here. | 
| |
Fig. 9. The course of the temperature difference between T of air and T of the snow cover surface during the day 22.01.2021, 23.01.2021, 25.01-28.01.2021 | Conclusion The results of field measurements of air temperature, snow cover temperature, and snow cover height obtained using an autonomous automatic atmospheric-snow software and measuring complex in Irkutsk at the IRNTU site in January-March 2021, February-March 2023 are presented. The height of the snow cover was determined by a relatively sharp temperature change at the atmospheric air-surface boundary snow. It was found that there is a change in temperature in the snow cover at the same height during the day, while in the height range from 0 to 15 cm (0 cm is the underlying base) temperature fluctuations between min and max are insignificant compared with temperature fluctuations in the upper layers of the snow cover. It is shown that graphically, temperature changes in the snow cover at altitudes that are closer to the atmospheric surface of the snow cover have more pronounced amplitude diurnal cycles, in contrast to changes at low altitudes. A linear correlation has been established between air temperature and temperature at different heights in the snow cover, the correlation coefficient decreases with decreasing heights in the snow cover, provided that the maximum height of the snow cover is constant, for example, during the day. The phenomenon of cooling of the snow cover surface at certain hours during the day, when the surface temperature is lower than the air temperature, is shown. It is noted that the actual values obtained in an autonomous automatic real-time mode, such as air temperature, temperature and height of snow cover may have an applied value and over time, with the development of digitalization, may be in demand for managing the urban ecosystem of the city and/or individual territories.
References
1. Goncharova, O.Y., Matyshak, G.V., Epstein, H.E., Sefilian, А.R., & Bobrik, А.А. (2019). Influence of snow cover on soil temperatures: Meso- and micro-scale topographic effects (a case study from the northern West Siberia discontinuous permafrost zone). Catena, 183, 1-8. Retrieved from https:/doi.org/j.catena.2019.104224
2. Instructions to hydrometeorological stations and posts. Iss. 3. Part I. (1985). Meteorological observations at stations. Leningrad : Hydrometeoizdat.
3. Kalinnikov, V.V., Ustinov, A.V., & Kosarev, N.S. (2023). Measuring the height of snow cover using GNSS reflectometry. Vestnik SGUGiT, 1, 6-13. Retrieved from https:/doi.org/10.33764/2411-1759-2023-28-1-6-13
4. Yu, X., Wei, B., Zhang, X., & Yu, Х. (2015). Snow Depth Estimation Based on Multipath Phase Combination of GPS Triple-Frequency Signals. IEEE Transactions on Geoscience and Remote Sensing, 9, 1-10. Retrieved from https:/doi.org/10.1109/TGRS.2015.2417214
5. Bogorodskiy, P.V., Borodkin, V.A., Kustov, V.Yu., & Sumkina, A.A. (2020). Air convection in the snow cover of sea ice. Lyod i Sneg, 4, 557-566. Retrieved from https:/doi.org/10.31857/S2076673420040060
6. Kiselev, M.V., Voropay, N.N., Dyukarev, E.A., Kurakov, S.A., Kurakova, P.S., & Makeev, E.A. (2018). Automatic meteorological measuring systems for microclimate monitoring. In: China-Mongolia-Russia Economic Corridor: Geographical and Environmental Factor and Territorial Development Opportunities: IOP Conference Series: Earth and Environmental Science. First International Geographical Conference of North Asian Countries, 190, 012031. Retrieved from https:/doi.org/10.1088/1755-1315/190/1/012031
7. Shein, A.N., Ivanov, M.N., Ginzburg, N.A., Turchaninova, A.S., & Kurakov, S.A. (2022). Preliminary results of temperature measurements of the thickness of the snow cover of the Igan glacier during the ablation period of 2022. Scientific Bulletin of the Yamalo-Nenets Autonomous Okrug, 4, 94-107. Retrieved from https:/doi.org/10.26110/ARCTIC.2022.117.4.005
8. Chmykh, N.V., & Burgonutdinov, A.M. (2023). Determination of snow cover characteristics for calculating the freezing depth of a road structure on the example of the perm region. Transport. Transport facilities. Ecology, 1, 34-42. Retrieved from https:/doi.org/10.15593/24111678/2023.01.05
9. Royer, A., Domine, F., Roy A., Langlois, A., Marchand, N., & Davesne, G. (2021). New northern snowpack classification linked to vegetation cover on a latitudinal mega-transect across northeastern Canada. Écoscience, 3-4, 225-242. Retrieved from https:/doi.org/10.1080/11956860.2021.1898775
10. Fierz, C. (2011). Temperature Profile of Snowpack. In: Singh, V.P., Singh, P., Haritashya, U.K. (Eds.). Encyclopedia of Snow, Ice and Glaciers. Dordrecht: Springer, р. 1151-1154. Retrieved from https:/doi.org/10.1007/978-90-481-2642-2_569
11. Ponomarev, V.V. (2018). The thermal regime of the snow cover and the soil surface during the winter at the state nature reserve "Prisursky". Nauchnye trudy gosudarstvennogo prirodnogo zapovednika «Prisurskij», 33, 21-31.
12. Kotlyakov, V.M., Sosnovskiy, A.V. (2021). Estimation of the thermal resistance of snow cover based on the ground temperature. Lyod i Sneg, 2, 195-205. Retrieved from https:/doi.org/10.31857/S2076673421020081
Peer Review
Peer reviewers' evaluations remain confidential and are not disclosed to the public. Only external reviews, authorized for publication by the article's author(s), are made public. Typically, these final reviews are conducted after the manuscript's revision. Adhering to our double-blind review policy, the reviewer's identity is kept confidential.
The list of publisher reviewers can be found here.
The subject of the study, according to the author, is the results of measuring the temperature in the snow cover at the search winter site in Irkutsk. The methodology of the study is indicated in the article as an analysis of the parameters of measuring temperature in the snow cover using an autonomous automatic software and hardware atmospheric-snow complex developed at the Institute for Monitoring Climatic and Ecological Systems of the Siberian Branch of the Russian Academy of Sciences and installed on the search sites of the Irkutsk National Research Technical University (IRNTU) in Irkutsk. The measuring system is configured to record the temperature every hour and the results are transmitted to a remote server. From the analysis of the article, it can be concluded that the authors of the article use the method of analyzing the data obtained, their generalization and plotting the temperature distribution in the snow cover and in the atmosphere, as well as statistical research methods to identify the correlation coefficient between air temperature and snow cover temperature, The relevance of the topic is unconditional and consists in obtaining information about the temperature distribution in the snow snow cover, which is an important component of the climatic and economic characteristics of cold regions, since snow is important for ecological and climatic systems. In this regard, it is necessary to register the actual characteristics of the snow cover in time and space, i.e. monitoring the snow supply regime in particular and the hydrological regime in general, depending on the conditions of formation, deposition and melting. This is an important aspect of understanding the geoecological mechanism of hydrological processes. The research of the author of the article helps to solve the problem of developing a methodological apparatus for studying the actual temperature values for calculating the specific heat capacity of snow cover. They proposed to determine T using interpolation. The scientific novelty lies in the author's attempt to establish a linear correlation between air temperature and temperature at different altitudes in the snow cover on the basis of the conducted research, the correlation coefficient decreases with decreasing heights in the snow cover, provided that the maximum height of the snow cover is constant, for example, during the day. The author notes that the actual values obtained in an autonomous automatic real-time mode, such as air temperature, temperature and height of snow cover, may have an applied value and over time, with the development of digitalization, may be in demand for managing the urban ecosystem of the city and individual territories.This is an important addition in developing an understanding of the dynamics of water resources. Style, structure, content the style of presentation of the results is quite scientific. The article is provided with rich illustrative material reflecting the results of measuring temperature in the snow cover. The article is illustrated with visualized forms of photographs, graphs and tables. The bibliography is very comprehensive for the formulation of the issue under consideration, but does not contain references to normative legal acts and methodological recommendations on statistical data analysis. The appeal to the opponents is presented in identifying the problem at the level of available information obtained by the author as a result of the analysis. Conclusions, the interest of the readership in the conclusions there are generalizations that made it possible to apply the results obtained. The target group of information consumers is not specified in the article.
|

 Eng
Eng


