|
Physics of biology and medicine
Reference:
Sarimov, R.M. (2024). The effect of hypomagnetic conditions on the size of a person's pupil. Physics of biology and medicine, 1, 24–40. https://doi.org/10.7256/2730-0560.2024.1.43854
The effect of hypomagnetic conditions on the size of a person's pupil
Sarimov Ruslan Maratovich
ORCID: 0000-0002-2751-1615
PhD in Biology
Senior researcher, GPI RAS
38 Vavilova str., Moscow, 119991, Russia

|
rusa@kapella.gpi.ru
|
|
 |
|
DOI: 10.7256/2730-0560.2024.1.43854
EDN: RDFYOU
Received:
21-08-2023
Published:
30-08-2024
Abstract:
Earlier it was reported that hypomagnetic conditions resulting from a 100-fold decrease in geomagnetic field induction affect human cognitive processes, which was evaluated in several computer tests. Exposure in hypomagnetic conditions for 40 minutes led to a statistically significant increase in both the execution time and the number of errors in the tasks. The magnitude of this magnetic effect, averaged over 40 healthy subjects in 80 hour experiments, was about 1.7 percent. This paper describes the results of a study in which the characteristics of the state of the right eye of each subject were recorded on video, while the subject performed cognitive tests. It turned out that under hypomagnetic conditions, the pupil size increases. This effect was calculated based on the processing of a large array of data, including more than a million video frames. The average magnetic effect was about 1.6 percent. Taking into account the heterogeneity, the significance level of the effect is close to significant (0.07, ANOVA, the subjects' factor is random). Magnetic reactions recorded both for different cognitive tests and for pupil size observed simultaneously do not correlate. Approximately equal numbers of testers showed positive and negative effects in each test. Non-specific reactions to the magnetic field appear to be random.
Keywords:
biological effects, hypomagnetic conditions, magnetic fields, human magnetic response, eye pupil size, reaction rate test, Stroop test, Shepard test, color perception test, non-specific magnetic effect
This article is automatically translated.
You can find original text of the article here.
Introduction The role of the geomagnetic field (GMP) in the processes of vital activity remains unclear. Even the fact that some animals can navigate using GMP has not yet been fully explained [1,2]. The nature of the biological effects caused by such weak magnetic fields is a physical problem [3]. There are both epidemiological [4] and laboratory [5,6] studies showing a certain relationship between the level of electromagnetic fields of alternating current and human health. However, relatively little is known about the effect of a weak permanent magnetic field, of the order of GMP, on humans. There are only a few laboratory studies devoted to the study of cognitive effects and effects on the cardiovascular system of weak static magnetic fields, in particular hypomagnetic conditions. In [7], 24 subjects were exposed to continuous exposure to 50 hTl for two weeks. Before and after magnetic exposure, a number of psychological tests were conducted: a test for space perception, visual-spatial memory, visual-motor coordination, reproduction of time intervals, and the balance of the subject. In all these tests, no significant difference was found between the data obtained in geomagnetic and hypomagnetic environments. However, in another earlier work by this author with six subjects in the State Medical Institution, changes in the frequency of fusion of visual stimulus flashes were recorded, although no effects were found according to other psychophysiological tests and parameters of the cardiovascular system (systolic and diastolic pressure, heart rate) [8]. In the work [9], averaged over 55 subjects, the sensitivity of the human eye to a visual light stimulus in GU turned out to be 6-7% less than in GMP. In a series of studies led by Gurfinkel Yu.I., the influence of GU in the magnetic exposure system was studied, which was developed and created with the participation of the author of this publication and was actually the next version of the installation used in this publication. In [10], 32 people twice participated in two-hour experiments in GMP modes (30 min)/GMP(60 min)/GMP(30 min) and with the inclusion of hypomagnetic conditions GMP(30 min)/GU(60 min)/GMP(30 min). There was an increase of 10-15% in the rate of capillary blood flow of the subjects, a decrease of 3-4% in systolic and diastolic blood pressure, as well as an increase in cardiac interval time in the aged (over 40 years) participants of the experiment [10]. Similar effects were found in previously published work with fewer subjects [11]. Longer 8–hour experiments were carried out in [12], where the parameters of the cardiovascular system in eight subjects were studied in the same setup. Compared with the control conditions, the following effects were recorded in the GI: a decrease in heart rate (by about 4 beats per minute), a decrease in blood pressure (diastolic by 11 mmHg, systolic by 16 mmHg). The saturation of blood hemoglobin with oxygen under the action of GU has not changed. In another study, in the same magnetic exposure system, no statistically significant changes in EEG activity and in the cardiovascular system of the subjects were recorded during 8–hour exposure to HG [13]. Thus, the available data on the effect of permanent MP with induction of the order of GMP and less on cognitive processes and the human cardiovascular system are insufficient and contradictory [14]. In previous studies [15,16], it was found that deprivation of GMP to a level below 400 nT affects human cognitive processes. Forty people participated in experiments twice in a study using four cognitive tests. Both the number of errors and the task completion time have increased in the GU. On average, the magneto-biological effect (MBE) for different measured parameters ranged from 1.5 to 2.5%. The total MBE, calculated as the average value for ~120 thousand individual tests, was 1.7±0.2%. This value was quite stable. When the data set was limited only to measurements of the task execution time, the average effect was 1.64% [15]. If we exclude from the array the results of six subjects who showed the maximum effect, then the average effect, equal to 1.49%, retained its statistical significance (p < 0.004) [16]. Thus, within the framework of this study, the average total magnetic effect in humans was formed based on the measured data of all subjects. The observed MBE was not a consequence of either the special effectiveness of any of the tests used, or the presence of particularly sensitive subjects. Temperature and atmospheric pressure were studied among possible significant factors, but they did not affect the results. It should be noted that in [16] all eight measured characteristics were subjective psychological reactions. It was also interesting to understand whether GU can influence human reactions, which are mostly independent of the will of the subject. Pupil size is a characteristic that was clearly recorded with the help of a camera when performing the above-mentioned psychological tests. Although the psychologically induced pupil constriction/dilation is known, the physiological response to light — the pupillary light reflex — is too pronounced to depend on psychological factors. Therefore, the pupil size was chosen to be monitored simultaneously with the above-described testing of subjects under exposure under control conditions and in the GU. The purpose of the present study was to find out whether GU can cause a change in the size of the pupil of the human eye. 2. Methods 2.1 Subjects There was no special selection of subjects, but in a group of 40 people there were men and women in equal numbers, as well as people older and younger than 40 years old. As a result, four groups of 10 people actually participated in the experiments: men older and younger than 40 and women older and younger than 40. Each subject was tested in both GMP and GU conditions. 2.2 Magnetic exposure system
The creation of the GU was achieved by compensating the GMP using four copper coils fixed along one axis in a special wooden box measuring 1×1×1.5 m3. A wire mesh was attached around the perimeter of the box, which shielded the subject from external electrostatic fields. The magnetic field inside the box was measured using ferrosonde magnetic field sensors mounted near the subject's head, approximately in the center of the box. The digital feedback system compensated (along the main axis) for the external magnetic field and its variations caused by urban electric transport and industrial noise. Four ring coils with a diameter of 1 m were located at a distance of 0.5 m from each other and had 40 turns in the side coils and 26.5 turns in the middle. The total active electrical resistance was 1.23 ohms. The heterogeneity of MP in the working space of the system (head and body of the subject) did not exceed 2%. The main axis of the system was oriented parallel to the GMP vector (44 µT) with an accuracy of 0.5 O. The bandwidth of the feedback system was about 10 Hz, with a measurement frequency of 1000 Hz MP. The residual MP value inside the box during the experiments did not exceed 0.4 µT along the main axis and 0.6 µT in perpendicular directions. 2.3 Testing procedure Each subject was tested twice; the second experiment was usually conducted 30-50 days after the first. In one of these two sessions, GUS were used, and in the other, for comparison, the same conditions were used, but without GU, that is, the experiment was conducted in GMP. In order to exclude a possible contribution from the order of the sessions of GU and GMP, the order of their conduct for half of the subjects was the opposite in relation to the other half of the subjects. The task processing time and the number of errors were measured in the following tests: (i) the speed of performing a simple motor reflex, (ii) recognition of colored words, (iii) short-term color memory and (iv) recognition of rotated letters. Two of these tests were modifications of the well-known J.R. Stroop and R.N. Shepard tests. In total, eight parameters were measured in this study. The protocol is described in detail in [16]. It is important to note the following: each of the 80 experiments consisted of three time periods: 10 minutes of adaptation to experimental conditions and preparation for testing in GMP; 10+10 minutes in control conditions of GMP; and 10+10+10+10 min of testing under GMP conditions (in 40 “simulation” or "sham" experiments) or in the GU (in the other 40 "real" experiments). One-minute rest intervals were placed between all these 10-minute periods, so that the total duration of the experiment was 76 minutes. The subjects did not know in what conditions the experiment took place in GMP or GU. Table 1 Scheme of experiments for each of the 40 subjects. Table 1 Schematic of the experiments for each of the 40 subjects. | Experiment Series | 1 | 2 | 3 | 4 | 5 | 6 | 7 | | Time | 0-10 min | 10-30 minutes | 30-70 min | | Experiment 1 (or 2) |
Adaptation (GMP) | Control(GMP) | Real Impact (GU) | | Experiment 2 (or 1) | Adaptation (GMP) | Control(GMP) | Imaginary/Sham (GMP) | A special device was made to register eye movements. A plastic frame fixed on the subject's head held an ACE-S560H analog video camera (0.05 lux, 600 lines) in front of the subject's head. A filter was installed in front of the camera to cut off light with a wavelength of less than 810 nm. The sensitivity of the camera was sufficient to operate in the IR range. IR LEDs located around the camera illuminated the area of the right eye, which made it possible to significantly contrast the pupil of the eye compared to the rest of the subject's face. Pupil movements were recorded in MPEG-4 digital format with conversion to 8-bit gray using a video capture device. The speed was 25 frames per second; the duration of each of the 80 recordings was 76 minutes. It can be easily calculated that in total about 9 million frames were collected in this study, half of which were obtained in GMP conditions, and half in GU. 2.4 Data measurement and processing An original computer program has been developed that allows you to process frames sequentially. After conducting 80 recordings, it turned out that one recording did not take place due to a technical malfunction. Therefore, the results of the corresponding subject were deleted from the dataset, and the program processed only 78 video files of 39 subjects. The preprocessing was as follows. First, the program cut out fragments of video recordings that corresponded to periods of adaptation to experimental conditions and short intervals of blinking of the eyes. There are just under 20 minutes of the control interval (control under GMP conditions), and 40 minutes of “sham" (GMP) or “real” (GU) exposure. Thus, we had 39 hourly records of the GMP/GMP type, i.e. records of “control"+”sham", and 39 records of the GMP/GU type, i.e. records of “control" + ”real” impact of GU. For each frame (680×572 pixels in size) of the film, the program found an image of the pupil of the eye, approximated the pupil with an ellipse and determined its parameters: short and long axes, angle of rotation, horizontal and vertical position of the pupil, Fig. 1. These values were stored in a file containing also the timestamp, the sequence number of the frame and the average brightness of the frame (average gray density in the 8-bit range 0-255). The average brightness was calculated for the entire area of the frame, with the exception of the eye pupil area. The results of each of the 78 experiments were presented in the form of a table/file, each row of which corresponded to one frame and included its processing data. Each column of the file was an array: the size of the ellipse, the brightness of the frame, etc. 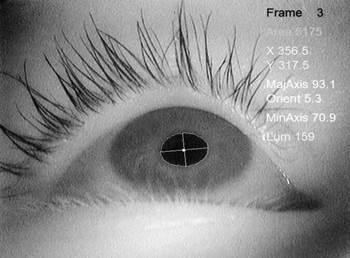
Fig. 1 Screenshot of the video frame processing program. The frame processing parameters are shown on the right: the frame number, the pupil area in pixels, the position of the pupil center, the length of the axes of the equivalent ellipse of the eye pupil in pixels, the tilt of the axes in degrees and the brightness of the frame. Fig. 1 Screenshot of the video frames processing program operation. Frame processing parameters are shown on the right: frame number, pupil area in pixels, pupil center position, length of the axes of the equivalent ellipse of the eye pupil in pixels, axes slope in degrees and frame brightness. The second stage of processing consisted in examining the recorded arrays for the presence of outliers. Due to the influence of many uncontrollable factors (blinking of the eye, codec failure, etc.), the arrays contained not only regular changes, but also noise. Some values in the arrays may deviate from the average values so much that their artifact origin is very likely. Such data is usually deleted from the samples. The program deleted an entire row of the frame from the array with processed data if one of the values in this row deviated from the corresponding average value of the sample by more than three standard deviations. The reduced arrays were used for further calculations.
During testing, the subject's eye rotates in different directions, so the pupil is visible from the camera aperture at different angles and takes the shape of an ellipse. The actual pupil size is closer to the main axis of the ellipse, since the minor axis changes as the cosine of the angle of projection onto the camera. We used the main axis as the main observable value, which was determined for each frame. The illumination of the eye in experiments could change for many reasons. These are variations of natural and artificial daylight in the room, and light from moving objects on the LCD monitor in front of the subject, and his individual position in the magnetic exposure system. Despite the fact that the average spectrum of light entering the camera has been shifted to the IR range, variations in optical radiation can contribute to the result due to the pupillary light reflex. Therefore, special attention was paid to this. The average illumination of the area around the eye pupil was calculated, as well as, at the same time, the size of the eye pupil for each frame. It turned out that there is a direct correlation between these two values, and not an inverse one, as one might expect, Fig. 2. This is because the camera position was not fixed relative to the face (subject). The subject could unknowingly change the camera position during the experiment. Thus, the distance between the camera and the eye changed frequently. The smaller this distance, the greater the illumination due to the IR radiation of the LEDs and the larger the pupil size visible by the camera; this is a geometric effect. At the same time, the average brightness for all frames in experiments with GU sometimes turned out to be higher than in experiments with GMP. For this reason, it has been suggested that the observed increase in pupil size during exposure in the GU was at least partially due to this geometric effect. Therefore, a correction was required to take into account the correlation and eliminate the geometric effect of brightness. The correction procedure consisted in determining the coefficients of simple linear regression and pupil size correction by subtracting the corresponding regression contributions. The slope of the regression line in Fig. 2 is  0.3230, so the adjusted size values were calculated as 0.3230, so the adjusted size values were calculated as  , where , where  is the initial pupil area, is the initial pupil area,  is the corresponding brightness, and is the corresponding brightness, and  is the average brightness averaged over the entire dataset. Of course, no correlation was found between the frame brightness values and the adjusted pupil sizes. Nevertheless, the magnetic effect remained statistically significant after correction (p<<0.001, t-statistic is 77). is the average brightness averaged over the entire dataset. Of course, no correlation was found between the frame brightness values and the adjusted pupil sizes. Nevertheless, the magnetic effect remained statistically significant after correction (p<<0.001, t-statistic is 77). 
Fig. 2 Correlation diagram between pupil size and illumination in the area around the pupil, measured by the brightness of the frame. The graph shows every hundredth point of more than three million points. The regression line is calculated for the entire set of points. Fig. 2 Correlation diagram between pupil size and illuminance in the area around the pupil, measured from the luminance of the frame. The plot shows every hundredth point of more than three million points. The regression line is calculated for the entire set of points. 2.5 Determination of magnetic effects Arrays of measured pupil sizes corresponding to a control or reference 20-minute interval and a 40-minute "exposure" interval, designated both   for "real" experiments for "real" experiments  and and  for "sham" experiments, respectively, for "sham" experiments, respectively,  and mean control, and and and mean control, and and  — effects (Table 2). Then — effects (Table 2). Then  , ,  , ,  and and  — the sample averages of these arrays, and — the sample averages of these arrays, and  , ,  , ,  and and  — their standard deviations, and — their standard deviations, and  — the index by which the subjects are numbered. — the index by which the subjects are numbered. Mathematical operations of the type  imply that multiplication by is applied to each element of the array imply that multiplication by is applied to each element of the array . Then we could define the result of exposure to the subject in a "real" experiment as the average value of the array, that is, as a normalized effect . Then we could define the result of exposure to the subject in a "real" experiment as the average value of the array, that is, as a normalized effect . .
However, this will not be a magnetic effect, since changes  in k in k  may be due to natural physiological rhythms, learning during testing, etc. The correct determination of the magnetic effect of the real impact of the GU will only be in comparison with the result of the "sham" experiment for each subject, where the average value of the array may be due to natural physiological rhythms, learning during testing, etc. The correct determination of the magnetic effect of the real impact of the GU will only be in comparison with the result of the "sham" experiment for each subject, where the average value of the array , or , or  is calculated in the same way. Thus, the average individual magnetic effect is defined as is calculated in the same way. Thus, the average individual magnetic effect is defined as  . As can be seen, with this definition, the average individual magnetic effect can be considered as the average value of the array . As can be seen, with this definition, the average individual magnetic effect can be considered as the average value of the array . An example of data processing for one subject can be found in Table 3. . An example of data processing for one subject can be found in Table 3. All normalized arrays of each subject were combined into single arrays,  and and  separately for "real" and "sham" experiments. From these arrays, the magnetic effect could be calculated separately for "real" and "sham" experiments. From these arrays, the magnetic effect could be calculated  (Table 2) as : (Table 2) as : 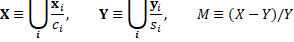
Table.2 Designations of the source and processed data. Table 2 Designations of initial and processed data. | Time of the experiment | 10-30 minutes | 30-70 min | | | Control | Impact | | Arrays source data | Real impact |
|
| | Sham experiment |

| 
| | Sample averages (standard deviations) | Real impact | () | ( ) ) | | Sham experiment |  ) )
|  ) )
| | Arrays normalized data (control normalization for each experiment) | Real impact | - | 
| | Sham experiment |
- | 
| | Arrays of individual magnetic effects | | |  Where Where
| | Individual average magnetic effect | | | 
| | Magnetic effect (for the whole group of subjects) | - | - | 
| | An array of elementary magnetic effects minus the individual average magnetic effects for each subject |
- | - | 
| Table.3 An example of processing data from one subject. Table 3 Example of data processing for one subject. | The initial data. The first four seconds of measurements in control and under exposure are shown for the “Sham” and “Real exposure" modes. | 
| | Normalized data (control normalization for each experiment) | 
| | Individual average magnetic effect. The average individual effect for one subject is marked in red. The density estimation function has been postponed as a distribution [17]. The density estimation function here and further was constructed in the same way for all distributions with the smoothing parameter σ=0.25. | 
| 3. Results The distributions of pupil sizes, normalized to their average values in the control, are shown in Fig. 3. These are distributions by relative values of pupil sizes or relative frequencies of the corresponding values, which are plotted as histograms. The distributions are presented in the form of curves normalized per unit area under them. The size of the arrays was 1692192 for experiments with real effects and 1671263 with imaginary ones. As you can see, the distributions differ in average values and are close to normal. The two-way t-test shows that the differences are statistically significant with a low probability of error. Without taking into account the heterogeneity of the combined arrays, the statistical significance is high, p<<0.001, taking into account heterogeneity (subjects were used in statistics as a random factor), the significance of the differences was p<0.07 (ANOVA, the “subjects" factor is random). 
Fig. 3 Distributions of pupil sizes normalized for control in the same experiment at "sham" (GMP) and "real" (GU) exposures, presented in the form of histograms of 1000 columns. The average values (dotted lines) and standard deviations of the samples were:  =0.9935, =0.9935,  =0.0908 and =0.0908 and  =0.9785, =0.9785,  = 0.0897 for GU and GMP, respectively. = 0.0897 for GU and GMP, respectively.
Fig. 3 Distributions of normalized to the control in the same experiment pupil sizes at "sham" (GMF) and "real" (HMC) exposures presented as 1000-column histograms. The mean values (dashed lines) and standard deviations of the samples were: =0.9935,  =0.0908 and =0.0908 and  =0.9785, =0.9785,  = 0.0897 for HMC and GMF respectively. = 0.0897 for HMC and GMF respectively. The average value of the GY effect can only be calculated, and not measured directly, so it depends on the definition of what a magnetic effect is. The definition  (see section 2.5) gives 0.79% for the adjusted dataset (see section 2.5) gives 0.79% for the adjusted dataset . The pupil size distributions corresponding to the "real" and "sham" experiments, i.e. built on arrays . The pupil size distributions corresponding to the "real" and "sham" experiments, i.e. built on arrays  and and , practically do not differ from those shown in Fig. 3, with minor changes (not shown). , practically do not differ from those shown in Fig. 3, with minor changes (not shown). 
Fig. 4 Distributions of individual average magnetic effects calculated for the same subjects: in this paper — by measurements of pupil size (purple solid line,  0.048) and in [16] — by parameters of cognitive tests (dotted line, 0.048) and in [16] — by parameters of cognitive tests (dotted line,  0.061); average values are given. The distributions are normalized to the unit area under the curve. The dots on the graph on the top right: a correlation diagram for individual magnetic effects. 0.061); average values are given. The distributions are normalized to the unit area under the curve. The dots on the graph on the top right: a correlation diagram for individual magnetic effects. Fig. 4 The distributions of individual average magnetic effects calculated for the same subjects: in the present work - from pupil size measurements (purple solid line,  0.048) and in [16] - from cognitive test parameters (dashed line, 0.048) and in [16] - from cognitive test parameters (dashed line,  0.061); average values are given. The distributions are normalized to the unit area under the curve. Dots in the graph on the upper right: correlation diagram for individual magnetic effects. 0.061); average values are given. The distributions are normalized to the unit area under the curve. Dots in the graph on the upper right: correlation diagram for individual magnetic effects. As mentioned above, taking into account the statistical heterogeneity of the combined data set for all subjects, the significance of the differences was p<0.07 is a value close to the accepted limit (p=0.05). Further analysis, however, is justified, since it concerns not the general average, but individual magnetic effects and the average shape of their distributions. The shape of the distributions differs significantly from the normal one, which allows us to draw some conclusions about the nature of non-specific magnetic effects. The individual magnetic effects reflect the sensitivity of the subjects to the 40–minute exposure to GY. Individual magnetic effects in the usual sense were calculated for each subject. To do this, the arrays  were divided, and an average value was calculated for each of them were divided, and an average value was calculated for each of them . The number of average values ( . The number of average values ( =39) was enough to create an array =39) was enough to create an array . The distribution of its elements is shown in Fig. 4. A similar distribution calculated according to the parameters of cognitive tests is also shown (see below). The distributions are presented as a density estimation function with a Gaussian kernel width equal to 0.25 standard deviations, which corresponds to a histogram consisting of about eight columns in the main range from . The distribution of its elements is shown in Fig. 4. A similar distribution calculated according to the parameters of cognitive tests is also shown (see below). The distributions are presented as a density estimation function with a Gaussian kernel width equal to 0.25 standard deviations, which corresponds to a histogram consisting of about eight columns in the main range from  to to . . It is important that the average magnetic effects taken individually are statistically significant. In all subjects, except two, who showed the lowest average magnetic effects of 0.13% and 0.04%, the level of statistical significance was high. < 0.001. The distributions of "real" and "imaginary" effects for each of the subjects are similar to those shown in Fig. 2. 4. Discussion The present study shows that a 40–minute exposure in the GU has a statistically significant effect on the subjects: the pupils of their eyes experience slight dilation. Despite the fact that the total average effect is small, the distributions of the measured values provide information about the nature of the magnetic effect on humans.
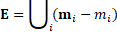
The distribution based on a joint array  combines two different distributions of magnetic effects that can be separated. The forms of these distributions are of interest. The first is the general form of "elementary magnetic effects", i.e., what is common to individual distributions, in addition to their average values. The distributions of elementary magnetic effects for each subject differ in average values, but have something in common — the shape that is visible after subtracting the averages from the arrays. The distribution of the array of elementary magnetic effects minus the averages for each subject combines two different distributions of magnetic effects that can be separated. The forms of these distributions are of interest. The first is the general form of "elementary magnetic effects", i.e., what is common to individual distributions, in addition to their average values. The distributions of elementary magnetic effects for each subject differ in average values, but have something in common — the shape that is visible after subtracting the averages from the arrays. The distribution of the array of elementary magnetic effects minus the averages for each subject 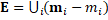 (Fig. 5 curve A) looks very similar to the distribution of normalized initial data (Fig. 3). The variance of the distribution (Fig. 5 curve A) looks very similar to the distribution of normalized initial data (Fig. 3). The variance of the distribution  is due to many random factors of brain functioning and the physical environment, while the distribution of individual average magnetic effects (Fig. 5 curve B) It is determined by the variability of individual magnetic sensitivity. In the absence of the MP contribution, ( is due to many random factors of brain functioning and the physical environment, while the distribution of individual average magnetic effects (Fig. 5 curve B) It is determined by the variability of individual magnetic sensitivity. In the absence of the MP contribution, ( ) according to the central limit theorem [18], the variance ) according to the central limit theorem [18], the variance (Fig. 5 curve A) in the transition to the distribution of individual average magnetic effects (Fig. 5 curve B) should decrease by (Fig. 5 curve A) in the transition to the distribution of individual average magnetic effects (Fig. 5 curve B) should decrease by  , where , where  is the number of averages, in our case (39 subjects), that is, the variance of the averaged array should it may be is the number of averages, in our case (39 subjects), that is, the variance of the averaged array should it may be  three times less than the observed value (Fig. 5 curve B). That is, the differences in the dispersions in the two arrays should be explained by individual magnetic effects. three times less than the observed value (Fig. 5 curve B). That is, the differences in the dispersions in the two arrays should be explained by individual magnetic effects. The fact that individual differences can lead to different magnetobiological effects for variable 50 Hz magnetic fields was previously published in [19]. The distributions in Fig. 5 show that the average magnetic effect is not due to the presence of a small hypersensitive group of subjects. Almost all the subjects showed sensitivity to GU. However, almost equal proportions of the subjects gave multidirectional reactions to GU, which led to a small average effect. At the same time, individual magnetic effects varied significantly within ±(10-12)%. Thus, the standard deviation is significantly greater than the average of the individual averages. For this reason, the overall average value is insignificant. A possible systematic a posteriori error was associated only with an increased level of frame brightness in the "real" set of experiments. However, this turned out to be insignificant, since the pupillary reflex occurs only in visible light, but not in IR radiation. Apart from the geometric effect, no other possible effects on pupil size were found. Neither LED illumination, artificial indoor lighting, nor daylight fluctuations on the street affected the pupil size, which was established during a special testing session. As mentioned above, there were  8 measurable parameters in the cognitive tests. An array of individual average magnetic effects was allocated for each of them, and all arrays were sorted according to the ordinal number of the subject. Let's denote for 8 measurable parameters in the cognitive tests. An array of individual average magnetic effects was allocated for each of them, and all arrays were sorted according to the ordinal number of the subject. Let's denote for  these ordered arrays, where the index these ordered arrays, where the index  1, 2, ..., 1, 2, ..., , is the ordinal number of the "psychological" meter used; , is the ordinal number of the "psychological" meter used;  0 means "the size of the eye pupil". Then you can evaluate the correlation between these arrays. A large correlation would mean that the same subject has higher or lower magnetic sensitivity scores, regardless of which test was used to determine his sensitivity. It turned out that all these arrays are not correlated with each other, the average value of the matrix of correlation coefficients was: 0 means "the size of the eye pupil". Then you can evaluate the correlation between these arrays. A large correlation would mean that the same subject has higher or lower magnetic sensitivity scores, regardless of which test was used to determine his sensitivity. It turned out that all these arrays are not correlated with each other, the average value of the matrix of correlation coefficients was:  0.09 0.09
This indicates that there were no particularly sensitive subjects among the 39 subjects, although in each individual test there were people who showed a fairly clear reaction to hypomagnetic effects. The constriction and expansion of the eye pupil occurs independently of the will of the person. This is an objective physiological reaction, not a reaction based on subjective will. Therefore, it is interesting that there is a similarity between the distributions plotted for both reactions (Fig. 4). Significant conclusions follow from the fact that this similarity exists along with the lack of correlation between individual averages of various measured quantities. (1) "Wings" in the form of distributions are observed at large absolute values of magnetic effects. The wings, with an area of only a few percent, are not as clearly defined as the main peaks, but they are visible in the form of individual distributions, both for pupil sizes and for parameters of psychological reactions. This makes it possible to cast doubt on the claim that there is a group of people in the human population who are particularly sensitive to electromagnetic fields. We are talking about the so-called "electromagnetic hypersensitivity syndrome", which has been repeatedly reported in the literature [20], that several percent of people can react strongly enough even to relatively weak electromagnetic fields that are not capable of causing noticeable heating of tissues. At first glance, the wing-like distribution of individual averages does not contradict the hypothesis of hypersensitivity. However, the lack of correlation between magnetic effects measured by the size of the pupil of the eye and psychological reactions (Fig. 4) indicates that people who demonstrate a pronounced magnetic effect may be different. According to the results, some people tested for a specific biological parameter will clearly respond to the effects of EMF. However, if a different parameter was selected for the measurement, then another insignificant group of people will react to the same EMF. It is assumed that hypersensitivity to EMF exists only as an accidental reaction. The physical and statistical reasons for the randomness of non-specific magnetic responses are given in [21].

Fig. 5 The distributions of arrays of elementary magnetic effects minus the averages for each subject (A) and the distribution of individual average magnetic effects (B) have significantly different standard deviations, 0.1 and 0.048, respectively. Fig. 5 The distributions of elementary magnetic effects with the subtraction of the average for each subject(A) and the distribution of individual average magnetic effects (B) have significantly different standard deviations 0.1 and 0.048 respectively. (2) As mentioned above, individual magnetic effects were determined for the same subjects, but based on their different characteristics, from the size of the eye pupil in this study, on the one hand, and from the number of errors and test processing time in the work [16] on the other. These magnetic effects turned out to be uncorrelated. At the same time, the distributions of these effects are quite similar: both have two large peaks and two small peaks, or wings, in Fig. 4. This fact indicates that the human reaction to the effects of MP is not systemic. An external factor, such as acoustic noise or light, can only cause a systemic reaction, which is due to human perception, the work of the central nervous system. In this case, the reaction of different organisms to an external factor should be similar. Apparently, the same is true with regard to internal, initially systemic factors, for example, biological rhythms. Unlike such systemic factors, MP is an agent that, bypassing human signaling receptor systems, acts directly on tissues, which means it acts haphazardly, randomly. This is precisely what is observed as the absence of correlation, see (1), between different biological indicators when exposed to the test subject. During testing, the subject may be magnetically sensitive in one parameter and simultaneously insensitive in another parameter. (3) The previously obtained results [16] that changes between GMP and GU cause a measurable biological response in humans are consistent with the data [9]. The authors of the latest study concluded that their data do not contradict the so-called radical pair mechanism, see for example [22]. According to this concept, some animal species have a magnetic sense because GMP affects spin-correlated pairs in the cryptochromic photoreceptors of the retina. The results of this study disagree with the hypothesis that the human body's response to MP is related to the visual system. The lack of correlation between the results of various tests in (1) proves that the human reaction to the magnetic field is not a systemic reaction. Therefore, this is not a reaction caused by the visual analyzer and, in particular, changes in its retinal cryptochromes. Our data are consistent with the idea that there is no specific localization of MP targets in some a separate organ in the human body. For example, magnetic nanoparticles found in human brain tissues can be targets [23]. Magnetic nanoparticles are small magnets that behave like a compass needle; they can rotate in an external MP and cause a cellular response if embedded in the cytoskeleton [24]. In addition, magnetic nanoparticles generate their own relatively large MP at the mTl level. In turn, this MP can influence magnetically sensitive radical pair biochemical reactions [25]. So an external MP of more than 200 NT could influence the dynamics of magnetic nanoparticles, and their own mTl field could cause biological effects [26]. 5. Conclusion A hypomagnetic field with an induction of about 400 NT dilates the pupil of the human eye by an average of 1.6%. Given the heterogeneity, this effect is close to significant (p<0.07, ANOVA). This result is based on video recordings of human eyes during cognitive testing of 39 people in a normal geomagnetic environment and when exposed to hypomagnetic conditions. It is shown that there are two types of magnetic effect distributions: (i) the distribution of elementary magnetic effects and (ii) the distribution of individual average magnetic effects. The standard deviation of these distributions is significantly higher than the average value of the distributions, which makes the total average magnetic effect uninformative regarding the nature of magnetic effects in humans. The distribution of individual average magnetic effects has a multi-peak shape, which is almost the same for all studied parameters. The maximum effects and distribution peaks for each measured parameter are formed by the contribution of different people. The hypomagnetic effect studied in 39 subjects, measured by the size of the pupil of the eye and eight cognitive parameters, is probably a common nonspecific magnetic effect in the human population. Due to the fact that the magnetic reactions observed simultaneously for different parameters do not correlate, these reactions to the magnetic field seem to be random, and a large amount of observations is required to register a very weak total magnetic effect. The author is grateful to V.N. Bingi for valuable advice and comments and T.A. Matveeva for her help in the work.
References
1. Johnsen, S., & Lohmann, K. J. (2008). Magnetoreception in animals. Physics today, 61(3), 29-35.
2. Mouritsen, H. (2012). Sensory biology: Search for the compass needles. Nature, 484(7394), 320-321. doi:10.1038/484320a
3. Binhi, V. N., & Rubin, A. B. (2022). Theoretical Concepts in Magnetobiology after 40 Years of Research. Cells, 11(2), 1-15. doi:10.3390/cells11020274
4. Schüz, J., Lagorio, S., & Bersani, F. (2009). Electromagnetic fields and epidemiology: an overview inspired by the fourth course at the International School of Bioelectromagnetics. Bioelectromagnetics, 30(7), 511-524. doi:10.1002/bem.20510
5. Ghione, S., Del Seppia, C., Mezzasalma, L., Emdin, M., & Luschi, P. (2004). Human head exposure to a 37 Hz electromagnetic field: effects on blood pressure, somatosensory perception, and related parameters. Bioelectromagnetics, 25(3), 167-175. doi:10.1002/bem.10180
6. Cook, C. M., Saucier, D. M., Thomas, A. W., & Prato, F. S. (2006). Exposure to ELF magnetic and ELF-modulated radiofrequency fields: the time course of physiological and cognitive effects observed in recent studies (2001-2005). Bioelectromagnetics, 27(8), 613-627. doi:10.1002/bem.20247
7. Beischer, D. E. (1971). The null magnetic field as reference for the study of geomagnetic directional effects in animals and man. Ann N Y Acad Sci, 188, 324-330. doi:10.1111/j.1749-6632.1971.tb13107.x
8. Beischer, D. E., Miller II, E. F., & Knepton, J. C. (1967). Exposure of man to low intensity magnetic fields in a coil system (Vol. 1018): Naval Aerospace Medical Institute, Naval Aviation Medical Center.
9. Thoss, F., & Bartsch, B. (2007). The geomagnetic field influences the sensitivity of our eyes. Vision Res, 47(8), 1036-1041. doi:10.1016/j.visres.2007.01.022
10. Gurfinkel, Y. I., At'kov, O. Y., Vasin, A. L., Breus, T. K., Sasonko, M. L., & Pishchalnikov, R. Y. (2016). Effect of zero magnetic field on cardiovascular system and microcirculation. Life Sci Space Res (Amst), 8, 1-7. doi:10.1016/j.lssr.2015.11.001
11. Gurfinkel, Y. I., Vasin, A. L., Matveeva, T. A., & Sasonko, M. L. (2014). Evaluation of the hypomagnetic environment effects on capillary blood circulation, blood pressure and heart rate. Aviakosm Ekolog Med, 48(2), 24-30.
12. Demin, A. V., Suvorov, A. V., & Orlov, O. I. (2021). Characteristics of healthy men hemodynamics in a hypomagnetic enviroment. Aviakosm Ekolog Med, 55(2), 63-68.
13. Kukanov, V. Y., Vasin, A. L., Demin, A. V., Schastlivtseva, D. V., Bubeev, Y. A., Suvorov, A. V., . . . Orlov, O. I. (2023). Effect of Simulated Hypomagnetic Conditions on Some Physiological Paremeters under 8-Hour Exposure. Experiment Arfa-19. Human Physiology, 49(2), 138-146.
14. Binhi, V. N. (2012). Two types of magnetic biological effects: individual and batch effects. Biofizika, 57(2), 338-345.
15. Binhi, V. N., & Sarimov, R. M. (2009). Zero magnetic field effect observed in human cognitive processes. Electromagn. Biol. Med., 28(3), 310-315. doi:10.3109/15368370903167246
16. Sarimov, R. M., Bingi, V. N., & Miliaev, V. A. (2008). Influence of the compensation of the geomagnetic field on human cognitive processes. Biofizika, 53(5), 856-866.
17. Wand, M.P., & Jones, M.C. (1994). Kernel smoothing. CRC press.
18. Rouaud, M. (2013). Probability, statistics and estimation. Propagation of uncertainties, 191, 1110.
19. Sarimov, R., Alipov, E. D., & Belyaev, I. Y. (2011). Fifty hertz magnetic fields individually affect chromatin conformation in human lymphocytes: Dependence on amplitude, temperature, and initial chromatin state. Bioelectromagnetics, 32(7), 570-579. doi:10.1002/bem.20674
20. Schüz, J., Petters, C., Egle, U. T., Jansen, B., Kimbel, R., Letzel, S., . . . Vollrath, L. (2006). The "Mainzer EMF-Wachhund": results from a watchdog project on self-reported health complaints attributed to exposure to electromagnetic fields. Bioelectromagnetics, 27(4), 280-287. doi:10.1002/bem.20212
21. Binhi, V. N. (2021). Random Effects in Magnetobiology and a Way to Summarize Them. Bioelectromagnetics, 42(6), 501-515. doi:10.1002/bem.22359
22. Gegear, R. J., Foley, L. E., Casselman, A., & Reppert, S. M. (2010). Animal cryptochromes mediate5 magnetoreception by an unconventional photochemical mechanism. Nature, 463(7282), 804-807. doi:10.1038/nature08719
23. Kirschvink, J. L., Kobayashi-Kirschvink, A., Diaz-Ricci, J. C., & Kirschvink, S. J. (1992). Magnetite in human tissues: a mechanism for the biological effects of weak ELF magnetic fields. Bioelectromagnetics, Suppl 1, 101-113. doi:10.1002/bem.2250130710
24. Binhi, V. N., & Chernavsi, D. S. (2005). The stochastic resonance of magnetosomes fixed in the cytoskeleton. Biofizika, 50(4), 684-688.
25. Binhi, V. (2008). Do naturally occurring magnetic nanoparticles in the human body mediate increased risk of childhood leukaemia with EMF exposure? Int J Radiat Biol, 84(7), 569-579. doi:10.1080/09553000802195323
26. Binhi, V. N. (2006). Stochastic dynamics of magnetosomes and a mechanism of biological orientation in the geomagnetic field. Bioelectromagnetics, 27(1), 58-63. doi:10.1002/bem.20178
Peer Review
Peer reviewers' evaluations remain confidential and are not disclosed to the public. Only external reviews, authorized for publication by the article's author(s), are made public. Typically, these final reviews are conducted after the manuscript's revision. Adhering to our double-blind review policy, the reviewer's identity is kept confidential.
The list of publisher reviewers can be found here.
The article by R.M. Sarimov “The influence of hypomagnetic conditions on the size of a human pupil” describes the results of studies on the influence of hypomagnetic conditions conducted by the author with 40 subjects. The work was generally done at a good experimental level. However, the perception of the article, especially among biologists, will not be easy, due to the excessive overcomplicated presentation of a fairly simple and accepted procedure for normalizing results. To improve the perception of the article, the following adjustments are required: 1) The design of the experiment is distributed according to the introduction, materials and results. I suggest describing the design in more detail in the materials, possibly using a table or diagram. 2) The abbreviations GMP and GMU are close to each other and difficult to separate. It may be worth coming up with another way of labeling or not using abbreviations at all. 3) The description of the normalization formulas in the text and the names of curves in the captions on the graphs is unnecessarily overloaded. This makes it difficult to read the text. Is it possible to simplify the description of an essentially simple normalization and transfer formulas to “Complementary materials”? The formulas in the text are not numbered and it seems that they are needed only once. In addition, some of the symbols are not used in the text, for example, in the labels of the axes of graphs. 4) There is not a single example of the original dynamic data in the text. With the help of a drawing with the initial data, it would be possible to illustrate the sequence of numerical processing of the results. 5) Transfer the first and second paragraphs from the results to the methods, since they describe the normalization and preparation of data. 6) It is not clear where such sizes of data arrays came from (p. 6, paragraph 2 in the “Results”), if this is all the data piled up on all the subjects, then which null hypothesis are the authors checking? Can such data sets be considered independent tests in assessing the validity of differences? Or is it necessary to compare the characteristic parameters for the subjects? 7) The control normalization used is common for biological experiments, therefore some of the formulas are clearly redundant and make it difficult to perceive the text (p. 6, 1 paragraph in the “Results”) 8) A more detailed description of the drawings is necessary. It is not clear from the description of the figures what the “Normalized distributions of individual magnetic effects” (Fig. 4) or “The average form of the distributions of individual magnetic effects (A) and the distribution of individual average magnetic effects (B)” (Fig. 4) 9) It is not clear in what form the distribution is given in Fig. 4, 5. Apparently, this is a function of density estimation. The smoothing parameter is not specified. Is it the same for different distributions? Why doesn't the author use the distribution function? Provide a link to the description of the density estimation function. 10) The captions under the axes in Figures 2,4 and 5 are confusing. In Figures 2.5 are relative units, in Figure 4 they are percentages. Is it possible to make standard scales on all charts? 11) For Figure 3, is it possible to specify the actual pupil size in mm, and not in pixels? 12) For Figure 4, is it possible to show individual effects on the subjects with circles on the curves. 13) The authors discuss the significance of the form of data distribution in the discussion. To characterize this form for distributions close to normal, an estimate of statistical moments is adopted not only of the 1st (average) and 2nd (variance) order, but also of the 3rd (asymmetry) and 4th (kurtosis). Is it possible to give numerical values of 1-4 statistical moments of the distribution of GMU effects for each subject and for the curves in graph 5? Perhaps, for higher-order moments, the authors will get more significant differences. 14) The conclusion in the sentence “Our data are consistent with the idea that MP targets are more or less evenly distributed throughout the human body” is not justified, since for this it is necessary to expose different parts of the human body to the magnetic field and compare the effects. Comments of the Editor-in-Chief dated December 30, 2023 : "All the comments of the reviewer have been taken into account by the author, the necessary amendments have been made to the corrected text uploaded to the publishing system"
|

 Eng
Eng


