|
DOI: 10.7256/2453-8922.2022.1.37931
Received:
23-04-2022
Published:
05-05-2022
Abstract:
The object of the study is the isotope composition of three aufeis (icing) in the Viluy River basin. Two of the three tested icing were located in the wide valleys of the streams-tributaries of the Viluy River, one on the flat bottom of the thermosuffusion sinkholes. The areas of studied icings did not exceed 30 sq. m., their thickness ranges from 45 to 100 cm. Stratification is recorded in the icings. The co-isotope diagram δ2H-δ18O shows that icing ice was formed from spring water and generally is isotopically “lighter” compared to the water of Kysyl-Yurekh stream and Viluy River. The isotope composition of the icing ice varies in a very narrow range: a) for icing 1 δ18O values vary from –19.3 to –20.9‰, δ2H values vary from –156.5 to –162.9‰; b) for icing 2 δ18O values vary from –19.7 to –22.4‰, δ2H values vary from –153.2 to –173.1‰; c) for icing 3 δ18O values vary from –19.8 to –22.7‰, δ2H values vary from –162.9 to –181.3‰. The similarity of the isotope profiles of icing 2 on Viluy and icing IB93-5 on Baylot Island and isotope profiles of icing 3 on Viluy and icing F192-6 on Baylot Island was noted, however, the scale of isotopic variations for icings on Baylot Island are 5-6 times greater than that of Viluy icings.
Keywords:
aufeis, permafrost, snow, river water, oxygen isotopes, deuterium, deuterium excess, Viluy, Yakutia, cryolithozone
This article is automatically translated.
You can find original text of the article here.
Introduction Ice floes are formed in the process of layer-by-layer freezing of water on a solid base. Ice is layered ice massifs on the surface of the earth, ice or engineering structures formed during freezing of periodically pouring (precipitating) natural or man–made waters[1]. Ice has been found in Siberia, Mongolia, Svalbard and Alaska, and Canada. Ice is distinguished in size from very small, with an area of less than 0.1 thousand m2, with a volume of up to 0.01 million m3 to giant, with an area of more than 1000 thousand m2, with a volume of more than 100 million m3. According to Yu.D. Chirikhin, ice up to 12 m high is found in the mountains of Northeastern Russia, and the greatest power ice – more than 15 m – was recorded in the basin of the Sr. Sakukan River in the north of Transbaikalia. Ice, as a rule, is formed in areas of harsh climate in severe winter frosts. Gradually freezing rocks and rivers displace water, which in some areas pours out a thin layer on the surface. Due to the large heat losses, the water quickly turns into ice, which creates the first portion of ice. After a while, the water breaks through to the surface again, spreads over the layer of newly formed ice, increases its thickness. This continues several times during the winter: the ice grows in thickness and in area, sometimes occupying the entire floodplain of the river valley, forming a solid ice massif[2]. The size of the ice varies from thousands of square meters to tens of square kilometers[1]. The largest glaciers are found in the north of Canada and Alaska, in the basins of the Yana, Indigirka rivers, on the tributaries of the Lena. According to aerial photography of the 1970s, there are more than seven thousand glaciers in the Lena River basin. They are called taryns. The Yakut word “taryn” in translation means cottage cheese. And, indeed, in summer, from a distance, the ice resembles a curd mass scattered across valleys and slopes among gray rocks and green spaces of vegetation. Initially, taryn was called ice on a mountain river. But then they began to designate giant, usually perennial ice in the northeast of Yakutia. The largest taryn occurs annually in the Ulakhan valley of the Moma River, the right tributary of the Indigirka. Volumes of millions of cubic meters are typical for ice. The thickness of such formations is 3-4 m, in some areas 5-6, and occasionally 12-15 m. Along the length of the river, ice is usually located in a continuous chain for tens of kilometers, then narrowing, then expanding again depending on the shape of the valley. Ice can take different forms and occur in a variety of places. For example, on the banks of rivers, lakes and seas there are coastal ice. They are formed as a result of the wave-breaking activity of water flows, tides, the release of groundwater in outcrops and usually form an ice cascade of shafts up to 3 m thick[2]. Most of the largest glaciers are located in areas of tectonic movements, where the earth's crust is fragmented by cracks. Under these conditions, taliks develop, along which the permafrost waters rise to the surface, mix with waters of surface origin and form a single stream of waters feeding the ice. In such places with a cold climate, ice covers up to 4% of the entire territory, and the total reserves of ice are estimated in billions of cubic meters. To the south, the size of the ice decreases, but their number increases. In temperate climates, groundwater ice is found mainly in shaded valleys, ravines, gullies, at the foot of slopes. Here, individual ice reaches only the first tens of square meters, and their thickness does not exceed 1 m [3]. On the Vilyu River, the formation of ice is active, including in the last 2-3 years. Since March 30, 2022, the movement of all types of vehicles along the ice winter road across the Vilyu River on 3 km of the Edigeen highway in the Vilyu district has been prohibited. This is due to the access of ice to the Vilyui River with a width of about 150 meters and a depth of 0.5 meters. In 2021, residents of Suntarsky ulus on the bank of the Vilyu River found dark brown ice. Yellow and brown ice may be of technogenic origin. On cold days, the demand for electricity increases, along with the volume of water use in hydroelectric power plants. At the first cold snap, late freezing and heavy snowfall, this can lead to the formation of ice. The reasons for the formation of such ice may be wastewater from the Mirninsky district. In 2020, ice blocked the ice crossing from the city of Mirny to the village of Krestyakh. The authors studied three natural glaciers near the village. Kysyl-Cheese on Vilyue. Physical and geographical conditions of the research area Geographical location of the research area The site of the field work was chosen, located on the left bank of the Vilyu River in its middle course (64°1’59.15’ s.w., 122°47’20.90’ v.d.). The research site is located about 10 km upstream of the village. Kysyl-Cheese in the Vilyuysky ulus of Yakutia. On its territory there is one of the largest and most studied Aeolian-permafrost formations in Central Yakutia – tukulan Mahatta[4]. Pre-quaternary and quaternary deposits A significant part of Central Yakutia, including the area of our study, is located in the Vilyui syneclise, a large negative structure within the Siberian Platform[5], composed mainly of sedimentary deposits of the upper Cretaceous system – sandstones, siltstones and clays[6]. These deposits are overlain from above by a sedimentary cover of deposits of the upper part (Pliocene) of the Neogene system – sands, sandy loams, loams (less often pebbles and gravel beds)[7]. The total thickness of the deposits of the Cretaceous system in the area of the village of Kysyl-Syr reaches 800-900 m, the Neogene deposits are much less powerful – only 10-15 m (Fig. 1). 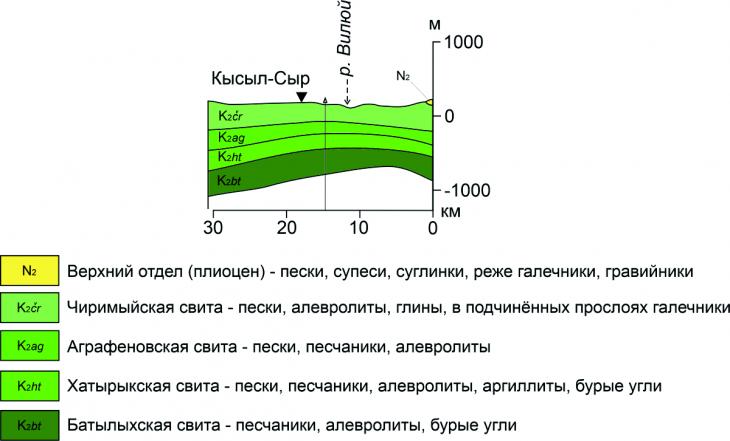
Fig. 1. Stratigraphic diagram of the section of deposits of the Cretaceous and Neogene systems through the valley of the Vilyu River near the village of Kysyl-Syr (according to the data of the 3rd State Geological Map ..., 1992)
Quaternary sand massifs with a thickness of 50-100 m are ubiquitous in the coastal lowlands and in the river valleys of Eastern Siberia[8]. The sands composing the territory of the Vilyu River valley in its middle course are mainly of alluvial origin and age from Karginsky (~39 thousand years) to Holocene (~11.7 thousand years) [6]. The sediments composing the upper tier of the Chebedinsky section of the Vilyui River terrace are characterized by an age of more than 36 thousand years, while sediments older than 42 thousand and 50 thousand years lie at the base of the terrace[9]. Most of these sands are homogeneous, of medium size. Quartz (6-96%) and feldspar (2-62%) predominate in their composition, according to their mineralogical composition they belong mainly to feldspar-quartz and only occasionally to quartz-feldspar. Depending on the degree of transformation of the sand material by slope processes, the mineralogical composition slightly changes towards an increase in the content of kaolinite (2-10%) and smectite (1-10%) [10]. Relief The territory where our research area is located belongs to the geomorphological region of the Central Yakut erosion-accumulative plain and the subdistrict of the Vilyuisk accumulative plain[11]. The main processes of relief formation are the accumulation of alluvium, coastal erosion of the deposits of the Vilyui terraces with subsequent redeposition of the material, Aeolian sifting, as well as cryogenesis processes. In total, in the middle reaches of the Lena River (near the confluence of the Vilyuya), M.N. Alekseev[12] identified 6 river terraces with heights of 15-16 m, 25-32 m, 40-45 m, 50-60 m, 65-80 m and 90-100 m. Low terraces are most clearly expressed, and in the composition of medium and low terraces, deposits of glacial and water-glacial origin are clearly distinguished[13]. Loose sediments exposed by natural outcrops of the ledges of the Vilyui terraces are actively destroyed and transferred by Aeolian flows[14], then accumulating into large arrays of dune sands – tukulans[4, 14]. Some researchers believe that the tukulans are relics of deflationary deserts formed in the periglacial zone in the Middle and Late Pleistocene [15]. Sedimentation has been going on on the Kysyl-Syr Tukulan for at least the last 28,400 ± 600 years[16], during which time sand particles have managed to acquire specific features that distinguish tukulan sand from other landforms. In addition to the typical relief elements characteristic of the river valley and tukulans, low-lying lake valleys are found on the territory of Central Yakutia near the study area. Among the suffusion, thermosuffusion and thermoerosion forms, thermosuffusion funnels[17] and thermocircles[10] are distinguished, developing along the banks of the Vilyui and its tributaries, where the depth of groundwater is small. Permafrost rocks Permafrost rocks in Central Yakutia are among the most powerful on Earth: sedimentary deposits of Jurassic and Cretaceous age in the middle reaches of the Vilyuya[18] have a thickness of up to 320 m and a continuous lateral and horizontal distribution [19,20]. According to the scheme of permafrost-landscape zoning of North-Eastern Siberia[21], the territory of the research site belongs to the Oleneksko-Vilyuisk hollow-uvalistoy north-wheeled landscape province. The temperature of permafrost rocks in this area is, according to various data, from -6 to -3°C[21] and from -2 to -4 °C[22], the volume ice content of these rocks is from < 0.2 to 0.4% [22,23,25]. The thickness of the seasonal thaw layer (STS) of permafrost soils varies depending on from the mechanical composition: the peat cover thaws the least deeply – the minimum depths do not exceed 0.5 m, while the minimum depths of seasonal thawing of sandy, sandy loam and loamy deposits start from 1.5 m (loam) and reach a capacity of 4.1 m (sand)[23]. Over the past 5.5 thousand years of the evolution of permafrost landscapes on the middle Fork, the thickness of the seasonally thawed soil layer has undergone minor changes, increasing only 0.1-0.2 times, while the temperature at the depth of zero values of seasonal fluctuations varied quite widely, increasing by about 0.5-2.5 °C every 3-3.5 thousand years[22]. In central Yakutia, taliks are widespread in the areas of riverbeds and lake and alas basins[24]. Also in this area, re-vein ice is common, resulting from a repeatedly repeated cycle of rock cracking in winter and filling the cracks formed with thawed snow water. The so-called edom deposits containing large amounts of organic matter[26] contain ice veins 5-10 m thick and 2-3 m wide (Fig. 2). 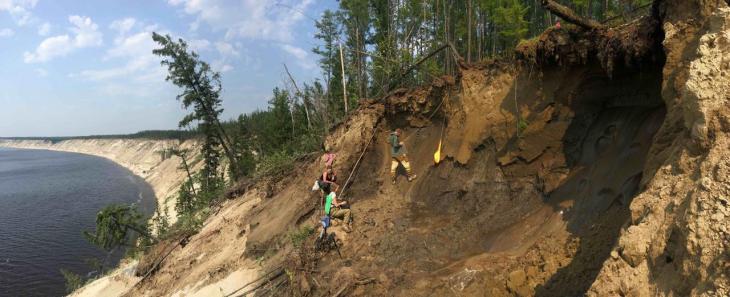
Fig. 2. Re-vein ice and the edom deposits containing them, uncovered in the outcrop of the actively collapsing high left bank of the Vilyu River. Photo by A. Belik The extracontinental climate of Central Yakutia with maximum average air temperatures above +35 °C and low average annual precipitation of less than 300 mm/year, moreover, highly differentiated by months [22,27] is similar to the desert climate, which is indicated by tukulans[4], where there is practically no vegetation cover. Nevertheless, the areas of the territory where there is a lower depth of permafrost, for example, the bottoms of thermosuffusion craters or stream valleys, are characterized by a large variety of vegetation (Fig. 2). Climatic characteristics
Central Yakutia in the Vilyuysk region is characterized by a sharply continental climate, the reason for the formation of which is in the area of the highest pressure on Earth - the winter Siberian anticyclone, whose spur extends almost over the whole of Yakutia[28]. The characteristic features of the climate are a combination of wide amplitudes of air temperatures throughout the year (from -60 to +37 °C) and low average annual precipitation[27]. The lowest temperature during the year falls in December – January to an average of -34.5 °C, and rises in July to 19.2 ° C with periodic increases of 10-15 ° C (Fig. 3a). Frosts begin around the first decade of September and end by the end of May. The wettest month of the year in Vilyuysk is July, when the level of precipitation reaches 50-52 mm, and the least amount falls in February and March – 11-13 mm. 300-400 mm of precipitation falls during the year (Fig. 3b). At the same time, the snow cover is also established from the beginning of September, reaching at first insignificant (less than 1 cm) heights, then increasing to 26 (on average) and more cm in October. At the same time, the maximum height of snow cover in September-October may increase to 26-31 cm in some years. The snow cover remains stable for 6 months (from November to April), thawing by the middle of May by almost half, and by the beginning of June disappearing completely (Fig. 3g). The study area is characterized by the predominance of winds from the west and south-west directions. In winter, the presence of a steady easterly wind is also characteristic. During the summer period, the winds blow in each direction for almost the same amount of time, the northern direction prevails relatively (Fig. 3b), from where the winds bring moist air masses, which explains the peak of the average monthly precipitation in July (Fig. 3b)[29]. 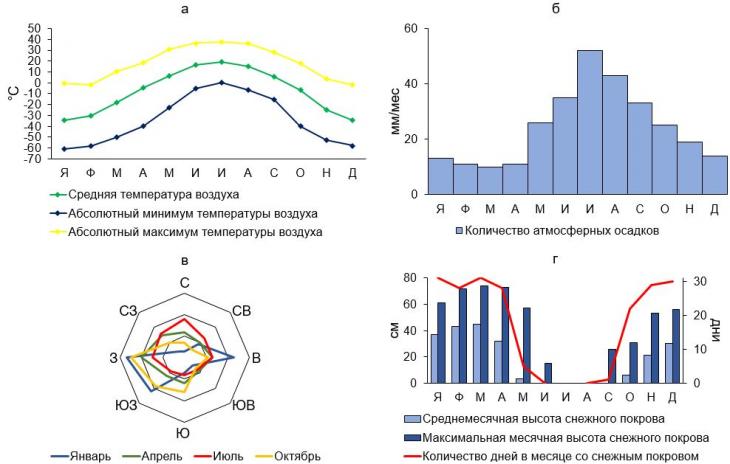
Fig. 3. Climatic characteristics of the territory of Central Yakutia near Vilyuysk: Average, minimum and maximum monthly air temperatures (a), average monthly precipitation (b), average monthly number of days with winds of different directions (c) and average monthly and maximum snow cover height indicating the average number of days with snow cover for the month (d) Hydrological and hydrochemical characteristics and ice phenomena on rivers Vilyu is one of the largest rivers in Yakutia (the longest of the left tributaries of the Lena River and the second longest tributary of the Lena after the Aldan), originates on the Syverma plateau in the Krasnodar Territory, then flows through the Vilyu plateau and the Central Yakut lowland. The total length of the Vilyuya riverbed to the confluence with the Lena is 2,450 km, the tortuosity coefficient is 1.2[30]. The area of the Vilyui basin is 57,300 km2 [31]. The natural flow of Vilyui is largely regulated [30,32] – there are several large reservoirs on Vilyui, the largest of which is Vilyui[30]. The hydrological regime of Vilyuya before the regulation of runoff (Fig. 4A) included the following phases: winter low water with almost zero runoff (from early November to early May), during which the river is ice-bound; a sudden flood (from early May to late July), the peak of which falls on the third or fourth week of June, when extreme water flow rates of up to 9,000 m3/s are observed; flood period (from the beginning of July to the end of October), water flow rates in which range from 1,000 to 2,000 m3/s. After the Vilyui runoff was regulated, the values of extreme flow rates in the flood (also stretching from the beginning of April to the first half of August) decreased to about 4,000 m3/s, and the phases of the hydrological regime became less distinguishable by the hydrograph (Fig. 4B). Accumulations of runoff changes during the winter period (from October to April) for the period from 1967 to 2007 amounted to 350 km3 (Fig. 4B)[33]. 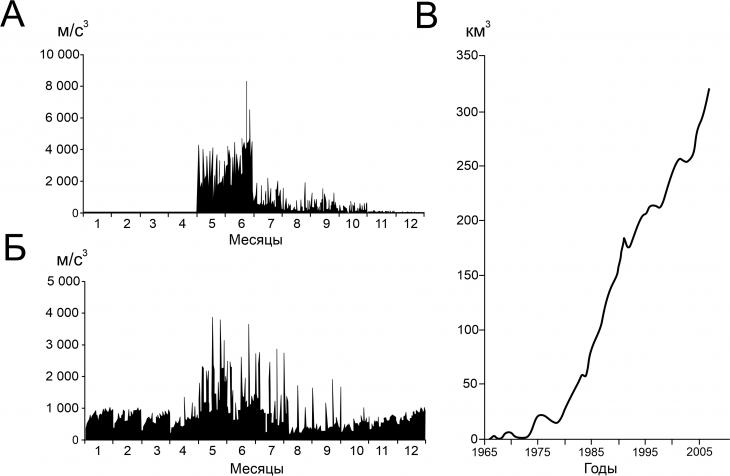
Fig. 4. Hydrographs of the Vilyui River in the alignment of the Suntar settlement before the construction of the Vilyui HPP cascade (A) and after (B), as well as accumulation of runoff changes during the winter period from 1967 to 2007 (C). From [33] As one of the sources of flood formation, often formed ice can act as ice dams that prevent the free passage of flood waters [34]. The relative ice content in the area of the middle course of the Vilyui (the ratio of the total area of ice to the total area of the river basin) is 0.01-0.05. Western and Central Yakutia, mainly flat, are not a place of concentration of a large amount of ice, unlike Eastern Yakutia, where due to the mountainous terrain there is a high degree of disequilibrium in the development of the longitudinal profile of rivers, and the relative ice content reaches 0.05 or more [35]. The waters of the Vilyui and its large tributaries belong to the bicarbonate class, the calcium group (HCO 3 – Ca), their mineralization is small, it averages 166.3 mg/ l, the total content of Ca 2+ and Mg 2+ ions is low (up to 2.1 mg-eq/l), that is, the waters are very soft. They are close to neutral in acidity (pH = 6,9-7,9). The content of suspended sediments does not exceed 15.0 mg/l [36]. The bottom of the Vilyuya is differentiated by the granulometric composition of suspended sediments: on the bottoms of the tributary rivers and the Vilyuya itself, above the confluence of the Tung River downstream, a significant part of the sediment structure is occupied by pebbles (5-27%), below the confluence of the Tung downstream of the Vilyuya, the bottom is composed almost entirely of sandy sediments [37]. Soil cover of the territory There are 9 zonal, 2 azonal and 7 intrazonal types of soils on the territory of Central Yakutia. The large size of this region and the variety of landscape conditions cause a wide variety of soil types found here [39]. In the middle taiga zone of Central Yakutia, podzols [38] and sod-podzols[39] dominate among zonal soil types, since the imposition of the sod process on private soil–forming processes is a frequent phenomenon[40]. In addition to them, malt, pale brown and pale yellow soils are also very common [38,40,41]. In addition, chernozems, meadow-chernozem and chernozem-meadow soils occupy not the last place among zonal soils[38]. Chernozems are often found in complexes with malt at various stages of the development of the landscapes of the Altai basins, where arable farming is possible[42]. Upstream of the Vilyuya, in the area of the confluence of the Tyung River into it, the composition of the soil cover also includes typical and gleevate cryozems, as well as peat-cryozems and peat-gleev soils. Profiles of alluvial sod-gleevate and humus soils on low and medium floodplains have also been described in the Tuning basin[43].
During the survey of the soils of the key area in the middle reaches of the Vilyuya, 12 soil sections were laid. Among these sections, 5 formed a geochemically conjugate series on the left bank of the Vilyui. The sections revealed the profiles of the following soils: sod-podzols (Fig. 5a, b), sod-podburs (Fig. 5b), gray humus (Fig. 5g) and stratozems (Fig. 5d) [39]. 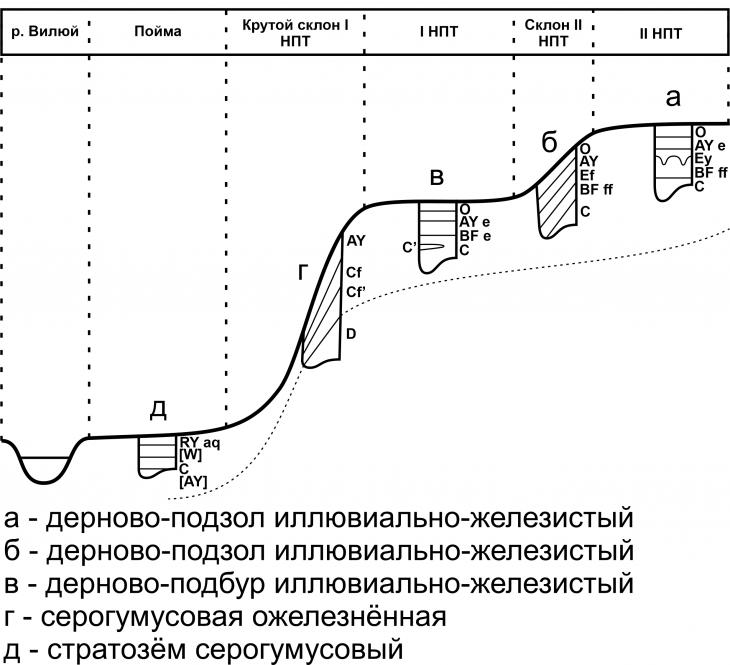
Fig. 5. The scheme of the soil-geochemical catena on the left bank of the Vilyu River. Soils: sod-podzol illuvial-ferruginous (a, b), sod-podbur illuvial-ferruginous (c), serohumus ozheleznennaya (d), stratozem serohumus (e). The dotted line shows the assumed boundary of the underlying rocks. From Y.K.Vasilchuk et al.[39] Objects and methods Studied ice Two of the three tested ice floes were located in the wide valleys of the streams-tributaries of the Vilyuya, one – on the flat bottom of the thermosuffusion funnel. The areas of the ice we studied do not exceed 30 m2, their vertical thickness varies from 45 to 100 cm. The stratification is pronounced in the ice layers: the layers of ice of almost the same thickness differ from each other in structure, density, transparency, color and the number of air bubbles included. There are layers of both fragile crumbly opaque ice of the stem structure with high porosity, and high-strength dense transparent layers of ice with visually distinguishable air bubbles. The ice is clean, there are practically no soil inclusions. One of the two ice floes studied by us was blocked by a sand deposit with a thickness of about 10 cm. Ice No. 1 Ice No. 1 (63°54’29” s.w.; 122°32’27” v.d.) (fig. 6a) is located in the valley of the Kysyl-Yurekh stream flowing into the Vilyu River. The bottom of the creek valley at the location of the ice is a sandy vegetation–free lowland with a width of 75-100 m (Fig. 7), complicated by several channels of the stream (Fig. 6b), as well as closed watered non-flowing depressions. It was next to one of these depressions that ice No. 1 was discovered. Probably, the source of water for its formation is an underground source, which also feeds this closed depression (Fig. 6g). In addition to the underground water source, a certain share in the supply of ice is made up of the surface waters of the Kysyl-Yurekh stream, which originates about 1 km north of ice No. 1 from the spring spring flowing from the lower part of the eastern slope of the Tukulan Mahatta. Throughout the course of this stream, it is fed by several more similar springs-springs, most likely spouting from an aquifer opened in the lower part of the eastern slope of the tukulan (Fig. 6b). The waters of the spring springs are transparent and relatively cold (their temperatures have values of 9-11 °C). At the same time, the water temperature in Vilyui and the Kysyl-Yurekh stream reached 16-18 ° C. Thermometric measurements of water were carried out by L.S. Lebedeva, a hydrologist at the P.I. Melnikov Institute of the Russian Academy of Sciences. The ice itself is a small ice mass in terms of surface area and thickness, covered with a sand deposit with a thickness of about 10 cm. The ice is transparent throughout the entire thickness of the ice. It has the characteristic features of layered ice: layers with different transparency alternate, while layers of white ice with less transparency are more powerful (5-7 cm), compared with transparent layers (up to 3 cm). Layers of glacial ice lie on top of sand similar to the one covering it, deeper than 45 cm there is a layer of ice with a high content of inclusions of this sand (Fig. 6a). 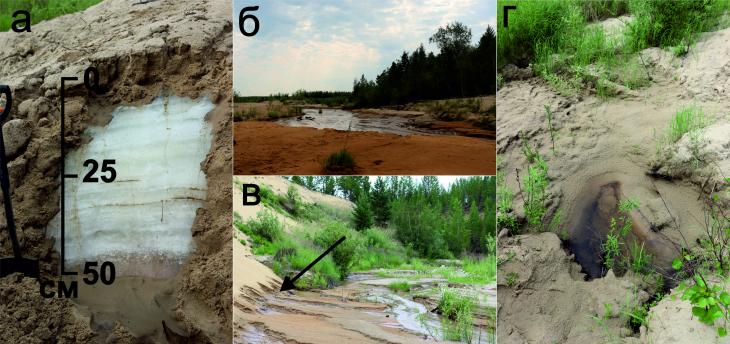
Fig. 6. Profile structure of ice No. 1 (a), landscape of the bottom of the valley of the Kysyl-Yurekh stream (b), exits to the surface of water springs from under the eastern slope of tukulan Mahatta (c) and a closed depression near ice No. 1, filled, presumably, with water from an underground source (d) 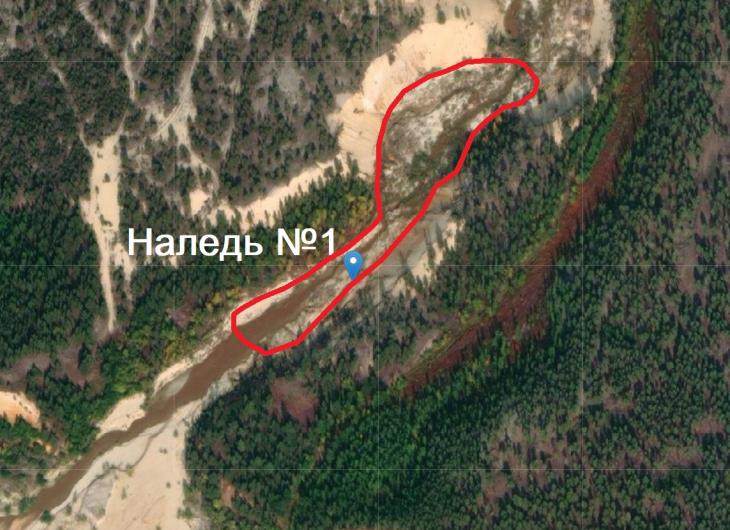
Fig. 7. The contour of the ice glade in the bottom of the valley of the Kysyl-Yurekh creek and the location of ice No. 1 (based on a satellite image from the open portal of the US Geological Survey (USGS) Ice No. 2 Ice No. 2 (63°54’45” s.w.; 122°31’27” v.d., fig. 8a) is located in the bottom of the valley of the stream crossing the southern part of tukulan Mahatta. The ice, which has a surface area of about 30 m2 and a thickness of up to 100 cm, is located at the foot of the eastern side of the valley (shaded), covered with a rare-coniferous larch forest with moss-lichen cover (Fig. 8b), while the western side is more similar in surface character to the tukulan: devoid of continuous vegetation cover and composed of unpaved sands (Fig.. 8b, c). The bottom of the creek valley has a unique botanical composition of vegetation cover, which includes moisture–loving species of mosses and lichens, blueberry and shiksha shrubs, sedge, as well as dwarf willow and cedar elfin bushes (Fig. 8b, Fig. 9). The source of water for ice No. 2 is a stream, as well as an underground water source that comes to the surface to the northeast of the ice. Near the ice on the thawed section of the ice glade there is a shallow depression filled with clear brownish water, which partly arose as a result of the melting of the ice, and partly due to the exit to the surface of the underground spring spring (Fig. 8b). Similarly to ice No. 1, the profile structure of ice No. 2 demonstrates layering, however, the difference is that in the upper part of the profile, sufficiently powerful layers with low transparency replace each other (up to a depth of ~ 65 cm, after which at great depths they are underlain by a powerful (~40 cm) layer of transparent pure ice, in which vertical cracks appear. There are practically no soil inclusions in the ice, as well as frozen layers of soil in the lower part of the ice (Fig. 8a). The only inclusion was observed by us at depths of 70-80 cm in the form of a thin lens-like layer of bright red sand. 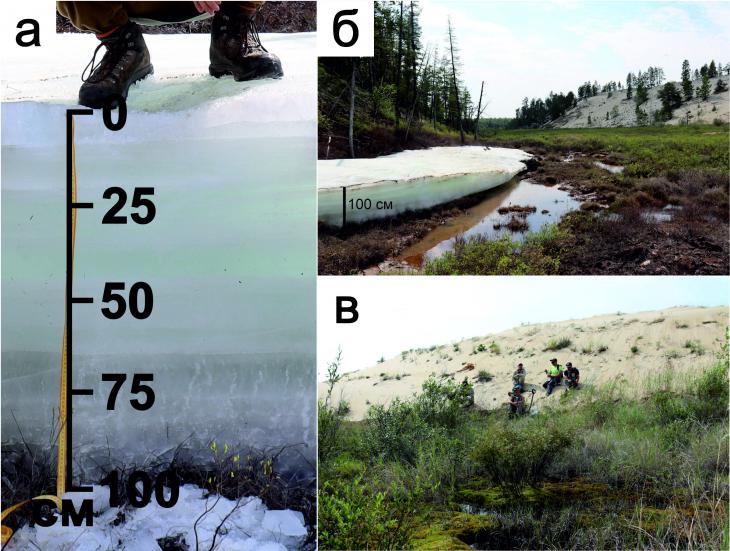
Fig. 8. Profile structure of ice No. 2 (a), landscape of the bottom of the thermosuffusion funnel (b) and its western side (c)
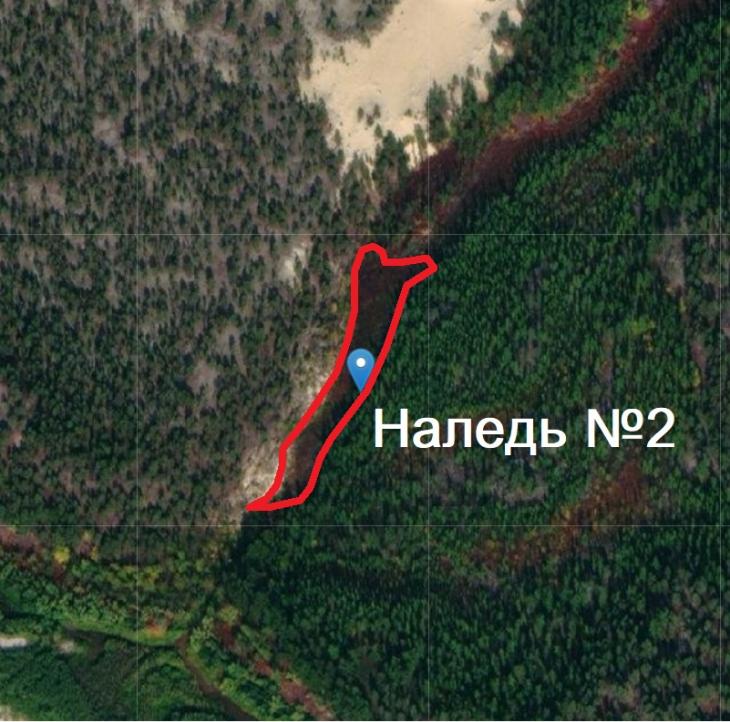
Fig. 9. The contour of the ice glade in the bottom of the creek valley and the location of ice No. 2 (based on a satellite image from the open portal of the US Geological Survey (USGS) Ice No. 3 Ice No. 3 (63°54’52” s.w., 122°31’04” v.d.) is located in the bottom of a stream originating in a thermosuffusion funnel (Fig. 10b) and flowing further to the confluence with the Vilyu River in a wide (more than 200 m) valley (Fig. 11) the steep sides of which are stacked with sand (Fig. 10b), and in the lower parts of the slopes, layers of red and brown hardened sands are often exposed, indicating the presence of groundwater here in the past (Fig. 10g). The ice cover has an area of about 70 m2 (Fig. 10g). The source of power for this ice is the water of the stream, which in the course of its flow is fed by the confluence of several more underground springs-sources into it. The water in the stream is clear, reddish-brown in color. The color characteristics of the ice layers in the ice profile reflect the color of the waters, for example, in the upper part of the profile, several layers of ice have a reddish hue. Despite the thickness of the ice is only 40 cm, it consists of a large number of thin layers of almost the same thickness of 1-2 cm (Fig. 10a). The top 5 cm of ice have a stalked structure, low transparency and density. Layers of relatively dense transparent ice are located below, and opaque dense layers begin deeper than 25 cm. 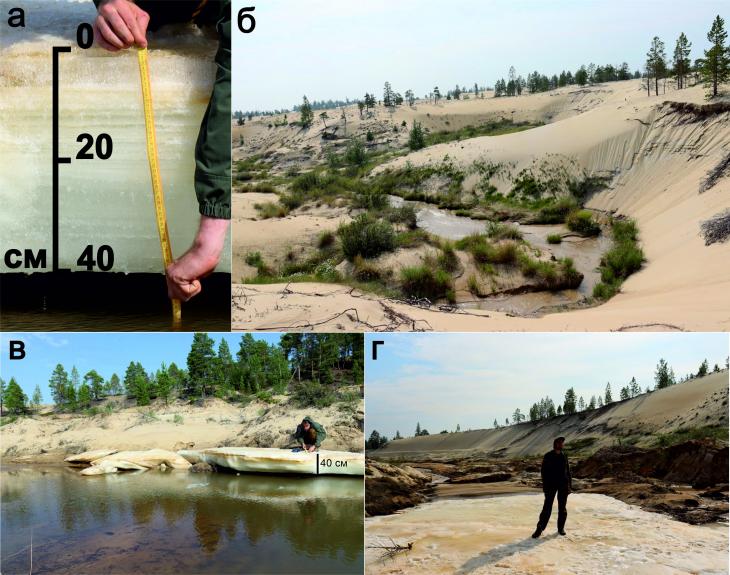
Fig. 10. Profile structure of ice No. 3 (a), a thermosuffusion funnel in which the stream feeding the ice originates (b), the northern (c) and southern (d) edges of the ice against the background of the stream valley One of the most common methods of detecting and further studying ice is the decryption of remote sensing data. In addition to the images of the ice sheets themselves, in the process of decoding, ice clearings are also noted – areas of terrain covered with ice during their maximum spread. Since the ice is characterized by a pulsating mode, the ice can periodically melt from certain parts of these clearings, however, there are no conditions for the development of a full-fledged vegetation cover. Thus, the leveled relief and the depressed state of the biocenosis are indirect signs of ice. The presence of an ice clearing directly indicates that the objects studied by us are precisely ice, and not thawing areas of river ice (Fig. 11). 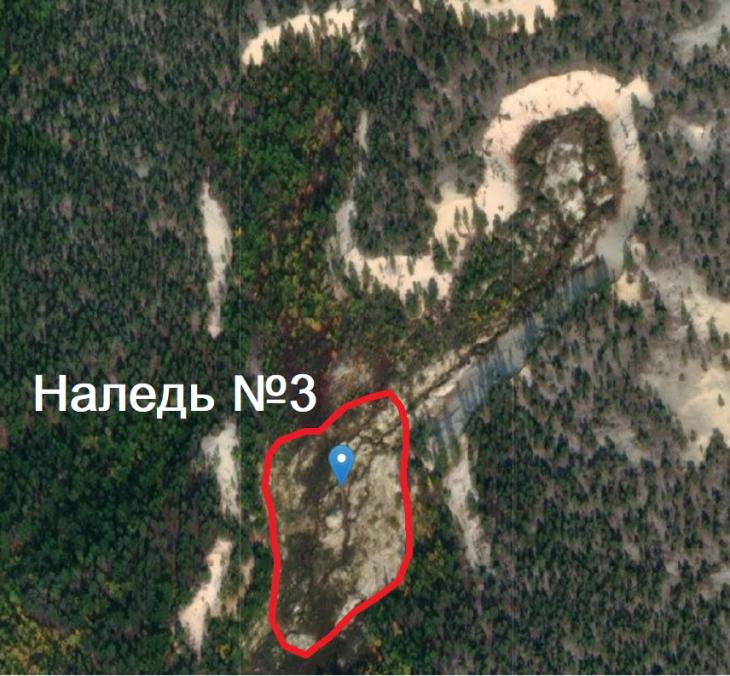
Fig. 11. The contour of the ice glade in the bottom of the creek valley and the location of ice No. 3 (based on a satellite image from the portal of the US Geological Survey (USGS) Field sampling of ice samples Ice sampling from the ice layers was carried out using a 5.1 cm diameter steel crown driven by a Bosch electric drill. The ice sample was drilled out of the vertical wall of the ice layer, and the upper 1.5-2 cm of each core was removed in order to avoid falling into the sample of flowing ice, the isotopic composition of which was changed as a result of prolonged contact with atmospheric air. Ice layers 1 and 3 with capacities of 45 and 40 cm, respectively, were tested along the entire vertical wall with almost no gaps, the thickness of the tested layer was 5 cm. Ice 2 with a thickness of 100 cm was tested in the same detail in the upper part at heights from 0 to 55 cm from the upper border of the ice, and in the lower part individual samples were taken at depths of 15-20 and 35-40 cm. The mass of each ice sample was 100-150 g. After thawing at room temperature during the day, the melt water was poured into plastic bottles with a volume of 10 ml. The vials were previously washed twice with a water sample, and air exchange with the atmosphere was excluded by sealing the bottle cap with an elastic Parafilm film. Also, when pouring the water sample, the ingress of air bubbles into the bottle was prevented. A total of 32 ice samples were selected from three glaciers. Laboratory isotopic studies of glacial ice Isotopic measurements were carried out in the Laboratory of Stable isotopes of the Faculty of Geography of Lomonosov Moscow State University on a Finnigan Delta-V mass spectrometer with the gas-bench option. International standards (V-SMOW, GRESP, SLAP) were used for calibration. The values of ?18 O and ?2 H are expressed relative to VSMOW in ppm, the measurement accuracy was ±0.1% for ?18 O and 0.8 % for ?2 N. The values of deuterium kurtosis (d exc) were calculated according to V. Dansgor's formula[44]: d exc = ?2 H – 8? 18 O. Results
In ice 1, the vertical distribution of ?18 O values showed a decrease in the values in the lower 10 cm of ice (from -20 to -21%), then an increase in the values in the lower part of the ice to -19.5% in the upper part and a slight negative peak at a depth of 10 cm (Fig. 12, Table 1). A similar distribution It was also noted for the values of ? 2 N, which vary from -160, -167 in the lower part, but there was no noticeable increase in the values of ? 2 N in the upper part of the ice. Judging by the distribution of the values of deuterium excess (d exc), for which there is a clear downward trend from the bottom-up – from 0.4-1.2 to -4, -5 in the upper layer, the upper layers of ice froze already from the last portions of water from the aquifer, without the influx of additional moisture, most likely with deep freezing of the aquifer. The weighting of the isotope-oxygen composition and a sharp decrease in the values of d exc to negative values from bottom to top shows that fractionation occurred during freezing of the portions of water that formed layers of ice. At the same time, in the groundwater that was the source of the formation of this ice, the values are on average -21.9%, the values of ?2N on average -173% and the values of d exc 2.1%, which is closest to the isotopic composition of the first lower layer of ice, i.e. it is obvious that it was growing from bottom to top (see Fig. 12). Table 1. Values of stable isotopes (?18 O, ?2 H and d exc) in the ice of glaciers in the valley of the Vilyu River, as well as in surface and groundwater | Sample No. | Chapter of selection, see | 18 O, ‰ | 2H, ‰ | dexc, ‰ | | Ice 1 | | Vil-21/10 | 0-5 | –19,5 | –160,9 | –4,9 | | Vil–21/11 | 5-10 | –20,0 |
–161,2 | –1,2 | | Vil–21/12 | 10-15 | –19,5 | –159,9 | –3,9 | | Vil–21/13 | 15-20 | –19,3 | –156,5 | –2,1 | | Vil–21/14 | 20-25 | –20,2 | –162,9 | –1,3 | | Vil–21/15 |
25-30 | –19,9 | –159,4 | –0,2 | | Vil–21/16 | 30-35 | –20,9 | –167,3 | –0,1 | | Vil–21/17 | 35-40 | –20,1 | –159,6 | 1,2 | | Vil–21/18 | 45-50 | –20,0 | –159,6 |
0,4 | | Ice 2 | | Vil–21/75 | 0-5 | –22,4 | –173,1 | 6,1 | | Vil–21/76 | 10-15 | –20,6 | –161,2 | 3,6 | | Vil–21/77 | 20-25 | –20,1 | –161,7 | –0,9 | | Vil–21/78 |
30-35 | –20,2 | –161,7 | –0,1 | | Vil–21/79 | 40-45 | –21,3 | –162,8 | 7,6 | | Vil–21/80 | 60-65 | –19,7 | –153,2 | 4,4 | | Vil–21/81 | 80-85 | –20,5 | –158,2 |
5,8 | | Ice 3 | | Vil–21/85 | 0-5 | –20,7 | –168,1 | –2,5 | | Vil–21/86 | 5-10 | –20,2 | –165,5 | –3,9 | | Vil–21/87 | 10-15 | –22,7 | –181,3 | 0,3 | | Vil–21/88 |
15-20 | –19,8 | –162,9 | –4,5 | | Vil–21/89 | 20-25 | –20,1 | –165,5 | –4,7 | | Vil–21/90 | 25-30 | –21,3 | –175,9 | –5,5 | | Vil–21/91 | 30-35 | –21,8 | –167,3 | 7,1 |
| Vil–21/92 | 35-40 | –21,8 | –171,3 | 3,1 | | R.Viluy | | Vil–21/94 | 0 | –19,7 | –152,5 | 5 | | Vil–21/97 | 0 | –20,0 | –150,0 | 10 | | Vil–21/98 | 0 | –19,9 |
–154,7 | 4,5 | | Vil–21/99 | 0 | –19,9 | –152,5 | 6,7 | | Kysyl–Yurekh Stream | | Vil–21/1 | 0 | –22,7 | –175,4 | 6,2 | | Vil–21/2 | 0 | –20,8 | –152,5 | 13,9 | |
Vil–21/3 | 0 | –19,9 | –152,5 | 6,7 | | Ground water | | Source for ice 1 | | Vil–21/4 | 0 | –22,2 | –176,5 | 1,1 | | Vil–21/7 | 0 | –22,2 | –171,9 | 5,7 | | Vil–21/9 | 0 |
–8,4 | –64,9 | 2,3 | | Source for ice 2 | | Vil–21/73 | 0 | –20,6 | –161,4 | 3,4 | | Vil–21/74 | 0 | –20,0 | –158,2 | 1,8 | | Source for ice 3 | | Vil–21/82 | 0 | –20,3 |
–162,8 | –0,4 | | Vil–21/83 | 0 | –20,7 | –162,8 | 2,8 | 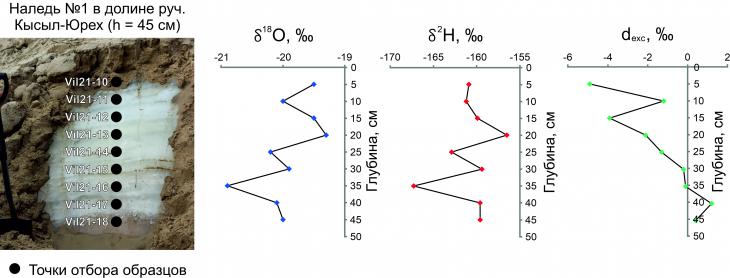
Fig. 12. Structure and isotopic characteristics of ice No. 1 In ice No. 2, a sawtooth distribution of ?18 O values was noted, an increase in values from -20.5 at a depth of 0.8 m to -19.7 at a depth of 0.6 m, then again a decrease in values to -21.3 at a depth of 0.4 m – in an ice layer that differs in color from the underlying ones (Fig. 13) and may indicate an influx free water from an open system (judging by the values of d exc = 7.6%, which is close to precipitation and surface waters, for example, the Viluy River and the Kysyl-Yurekh River, for which the average values of d exc were about 6-9%). 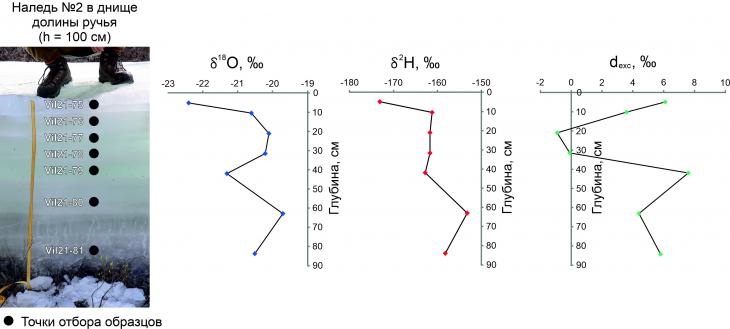
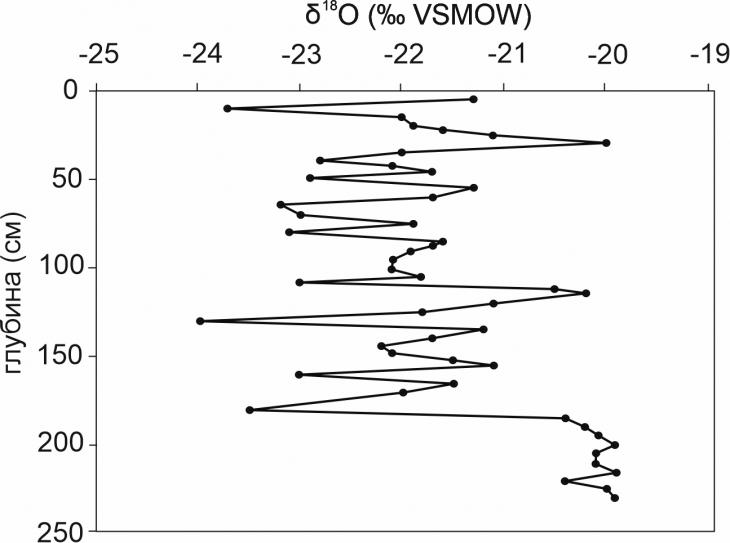
Fig. 13. Structure and isotopic characteristics of ice No. 2 The freezing of this water, apparently, was quite rapid and occurred under nonequilibrium conditions, because in the upper part of this layer at a depth of 0.3-0.2 m, a weighting of the oxygen isotopic composition (?18 O to -20.2, -20.1%) and a sharp decrease in the values of d exc to -0.9% were noted. The layer at a depth of 0.1 m is also more likely to have formed from groundwater, since the values of ?18 O =-20.6 and ?2 H = -161.2 are very close to the values for groundwater, which was the source of the formation of this ice (?18 O and ?2 H averaged -20.3 and -160, respectively). The uppermost layer of ice was undoubtedly formed with the participation of precipitation, most likely snow – this can be determined visually by the very white color of this layer (see Fig. 13), as well as by low values of isotopic composition – the values of ?18 O and ?2 H in this layer were -22.4 and -173.1, accordingly, the value of d exc = 6%, which is also typical for precipitation. In ice No. 3, the isotope diagrams generally showed a gradual decrease in the values from bottom to top in the depth range from 0.4 to 0.2 m, from -21.8 to -19.8 for ?18 O, from -171.3 to -163 for ?2 N, and a decrease in the values of d exc from 3-7 to -4.5, -4.7Thanks. The values in the ground water, which was the source of this ice, are slightly higher (the values of ?18 O and ?2 H were -20.5 and -162.8, respectively) and lower values of d exc (on average 1.2%), which probably indicates that the lower horizons of the ice were formed with the participation of not only groundwater, but also surface water (possibly autumn snow) (fig. 14). 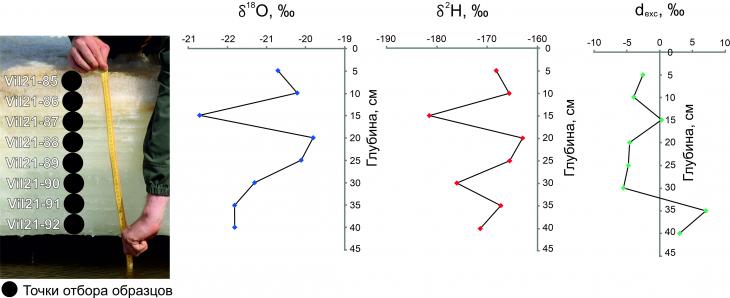
Fig. 14. Structure and isotopic characteristics No. 3
The marked gradual weighting of the isotopic composition and a decrease in dexc to negative values shows a gradual depletion of the water source for this layer of ice. A sharp decrease in the isotopic values in the overlying layer (depth 0.15 m) to -22.7% for ?18 O and to -181.3% for ?2 N, as well as an increase in the values of d exc to 0.3%, may reflect the outpouring of a possibly deeper groundwater horizon, which may differ in the content of impurities, since the upper horizons the ice is composed of darker, yellowish ice (see Fig. 14). Subsequently, during freezing and depletion of the water flow, fractionation and weighting of the isotopic composition of the ice occurred: the upper layer is characterized by values of ?18 O -20.2, -20.7, and values of ?2 H -165, -168, and the values of d exc are negative and are -2.5, -3.9. The joint diagram ? 2 H-? 18 O shows that groundwater and the ice formed from them are generally isotopically “lighter” compared to the surface waters of the Kysyl-Yurekh stream and the Vilyu River. Perhaps this is due to the fact that the surface water was taken in July, when the air temperature was high - even above +30 ° C and the water was subjected to evaporation (this may explain the position of the points of their isotopic composition below the GLMV). However, for each ice, enrichment in the values of ?18 O was noted as a result of isotopic fractionation during freezing, which resulted in a noticeably lower slope of the line ?2 H-?18 O, varying from 5.1 to 5.97 (Fig. 15). 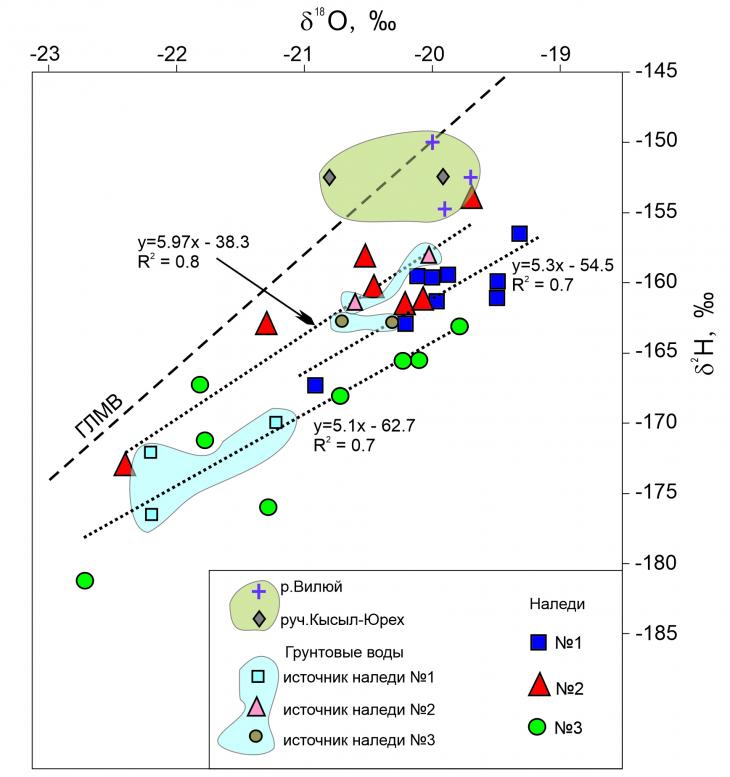
Fig. 15. The ratio ? 2 H-? 18 O in ice, ground and surface waters Discussion The process of ice formation is determined by the interaction of ice-forming waters with the region of negative temperatures. Often, liquid water remains between two or more layers of frozen ice, and the ice forming becomes like a layer cake. This “pie” can experience a lot of internal pressure due to the expansion of the freezing ice, which gradually lifts the upper ice layers - an ice mound is formed. It indicates the location of the source of the ice and the great stresses in her body. Such mounds can reach 5 m in height and 100 m in length. They are typical for Yakut taryns and often explode with a bang[2]. The first small ice mounds of heaving on the taryns appear already in October. In November, groundwater breaks through in many places, and taryn grows very quickly. In December, its growth slows down, as the ice armor already blocks many sources. Only in the upper part of Taryn, where water still has access to the surface, ice continues to grow intensively in January and February. The growth of taryn from March to early May slows down, and soon stops altogether, as the water finds a channel for runoff. The river breaks through the channel in the ice, and taryn gradually melts and collapses. However, the upper, most powerful part of the ice often persists throughout the summer. The rate of growth of ice and their number changes every winter. Sometimes the freezing of new layers of ice stops already in the first half of winter, and after a break resumes again. At the first stage, the ice is formed from river water, and in the second half of winter, when the rivers on the rifts completely freeze over, the ice feeds on subsurface and coastal groundwater. Freezing of rivers sometimes leads to winter floods. At the very end of 1967, due to the lack of snow and severe frosts, a large ice formed on one of the rivers in the Kama River basin. She backed up the river water, which began to approach the village of Sharshada, soon more than 10 houses were frozen to the windows. It is not uncommon to see two seemingly antagonistic phenomena on the river - river ice and polynyas. However, in fact, they are closely related to each other. The polynya marks the exit point of an underground, relatively warm spring, and large ice begins to form precisely from the polynya and its upper edge adjoins it. The ice serves as an ice barrier for spring flood waters. They have to bend around the ice, which contributes to its growth. In the spring, ice becomes an obstacle to the flow of melted snow water. Water flows are crushed and spread over the surface of the ice, and sometimes flow around the ice, destroying its edges. The melted ice blocks collapse, and powerful streams of water cut through the ice massifs and form new channels. The position of such channels changes from year to year - as a result, the ice section of the valley gradually expands and levels out. With the onset of frost, layers of ice are formed in the thickness of the soils underlying the ice, growing to 30-40% of the icy area of the valley, in summer they are pulled out, which leads to thermokarst subsidence and landslides. The ice formed annually on the same sections of the gentle slope or valley floor, produce specific ice clearings (Fig. 16), which stand out sharply against the background of the surrounding terrain. 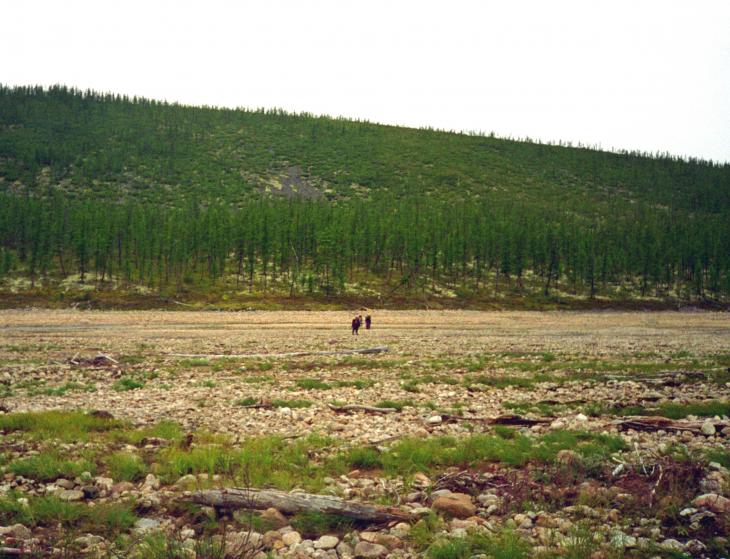
Fig. 16. Ice clearing on the Naledny stream, Baikal region. Photo by V. Shakhnovich The ledge of the high terrace of the river on the site of the ice glade is removed from the riverbed, and the riverbed itself looks like a delta with many branches. On the surface, there are ridges and powders of recomposed material on fresh turf, niches in coastal outcrops above the level of standing high waters, heave mounds, earthen pyramids, stone pavements located at different levels, flat areas compacted with ice, etc.[2].
Over time, the glaciers migrate along the river valley, and along with this, the appearance of the ice clearings gradually changes. Migration of ice is caused by changes in climatic or permafrost-hydrological conditions. With climate change, the position of the natural barrier formed by permafrost rocks that blocks the movement of the subsurface flow may change: with cooling, the boundary between the talik and the frozen rock will move towards the talik, and with warming - towards the frozen rock. During periods of cold snap, many glaciers increased in size, spread to new areas of the valley, on which there is currently no ice. In the Agayakan river basin in the Suntar-Khayat mountains, the area of ice has increased over the past 50-100 years, and some of them began to attack the forest. Ice has a significant impact on river flow, redistributing it from the cold period to the warm one. They absorb the entire winter runoff of small rivers. In large rivers, a significant part of the winter runoff goes to the formation of ice. In the mountainous part of the Indigirka River basin, ice is fed at a speed of more than 100 m3/s of water[2]. The consumption of Indigirka from September to October, when the rains end and the active layer begins to freeze, decreases by 4 times. In November, with the beginning of the growth of ice, the flow rate of the river in comparison with October falls three times. Over the next four months, the consumption of Indigirka is halved in each subsequent month compared to the previous one. At the end of March - April, when a huge mass of groundwater is spent on the formation of ice, the runoff becomes minimal [2] (Kotlyakov, 2002). With the arrival of summer, the water from the accumulated ice re-enters the rivers. The maximum impact on the river flow of ice is in the spring, at the very beginning of the flood, when the rivers have not yet opened from the ice. On one of the Yakut rivers, the ice runoff amounted to 18-46% of the total runoff in May, 10-20% in June, 4-10% in July and 1-3% in August. The largest in Russia and in the world is the Great Momskaya ice, or Ulakhan-Taryn (the basin of the Indigirki), has an area of more than 100 km 2, a volume of 0.25 km 3, reaches a width of 3.5 km, in some years it reaches a length of 120 km and a thickness of more than 7 m (Fig. 17). In the upper part of the Indigirka River basin, over 100 m3/s of water is consumed in winter to feed the ice, while the average annual consumption of this river is only 6.82 m3/s. 
Fig. 17. Bolshaya Momskaya ice. Photo by S. Karpukhin With a high coefficient of glaciation, thawed waters of glaciers can account for up to 20-24% of the annual and up to 50% of the spring runoff of the river. During the formation of ice in an open system, during the freezing of water-saturated (for example, channel) deposits, the water level gradually rises as a result of the water being squeezed out from the freezing front, while the water gradually pours out and freezes around the mounds, as well as on the surface of the channel ice. If the groundwater flow paths are blocked by permafrost barriers, the water outlet occurs in weakened zones upstream or downstream of the river. The foci of unloading of water-saturated strata under the influence of cryogenic pressure are usually large-block or boulder-pebble soils cooled to a temperature below 0 ° C, but not filled with ice [1]. Uneven freezing of soils, as well as different depth of occurrence of water barriers are the reasons for the transition of open aquifers to closed ones. Their freezing is often accompanied by the formation of soil-ice mounds of heaving, with a diameter of 2 to 200 m or more, with a height of 0.5 to 6 m or more. The structure of the ice depends on the thickness of the freezing layer of water on the ice and the temperature of its crystallization. With a decrease in the temperature and power of the layer, the size of the crystals decreases. Usually, columnar crystals of hexagonal shape with a size along the long axis mainly from 1 to 80 cm, and 10-15 cm in diameter are characteristic of ice. The formation of ice is accompanied by hydrogeochemical changes in ice-forming waters, during the crystallization of which part of the salts passes into an insoluble residue. The most common salts in ice are carbonate, silicon and sulfate. Mirabilite and hydrogalite are found in the body of ice formed due to highly mineralized waters. Sometimes salts give the ice a specific color. Thus, ice with a high iron content has reddish, yellowish and brown shades of ice. The chemical composition of the ice is heterogeneous. In some layers, the ice is strongly desalinated in winter, in others, on the contrary, it is characterized by an increased salt content. Interaction of springs-sources of water and ice Data on the ice regime of the rivers of Yakutia, presented on the website of Roshydromet, demonstrate the ice situation on the rivers of Yakutia in the first half of May 2020. It is at this time that the destruction of river ice usually begins. For example, the Vilyuya section in the area of the village of Nyurba and below the village on May 11, 2020 was already completely freed from ice, in the area of Verkhneviluysk the ice was partially destroyed, and just upstream of Vilyuisk the ice cover at the time of observation was solid. It was at this time that the descent of river ice from the rivers of the Vilyuya basin began. The phase of active ice destruction began in the first decade of May and was fully completed by the end of May. Since the glaciers studied by the authors were found in the valleys of streams in early July, moreover, in an abnormally warm year, we made the assumption that it was ice ice. According to L.S. Lebedeva, the layered structure of ice and underground springs located in the marginal parts of the valleys of streams are signs that it is ice ice in front of us. The relatively low temperature (9-11 °C) indicates the groundwater origin of these waters. Water from spring springs oozes from water-resistant layers that are opened in the lower parts of the slopes of tukulan Mahatta, above the ice along the streams. Freezing of ice occurs on the sandy part of the bottom of the valley of streams devoid of vegetation at the moment of the beginning of the ice age (in the second decade of November), when the snowfall begins at the streams. Southwest Yukon. The study of F.Michael[45] of the isotopic composition of the ice on 1817.5 km of the Alaska Highway (highway) in the southwest of Yukon allowed us to estimate from which waters the ice formed (Fig. 18).
18. Isotope-oxygen composition of ice from the ice formed on 1817.5 km of the Alaska Highway, Southwestern Yukon. From F.Michel[45]) The isotopic composition of groundwater is much heavier than the composition of winter precipitation. The lower layers of ice were almost completely formed from groundwater, since the value of ?18 O of ice in the bottom part at a depth of 1.8-2.3 m is -20.0%. In ice layers above 1.80 m, the isotopic composition of ice ranges from -20 to -24, which reflects the participation of isotopically lighter snow. Baylot Island in the territory of Nunavut. f.Michael and S. Paquette[46] studied the isotopic composition of glaciers and ice mounds on the island of Baylot in the territory of Nunavut (Fig. 19) in Canada, where long-term and seasonal ice formed from glacial meltwater and precipitation were found within a small valley. 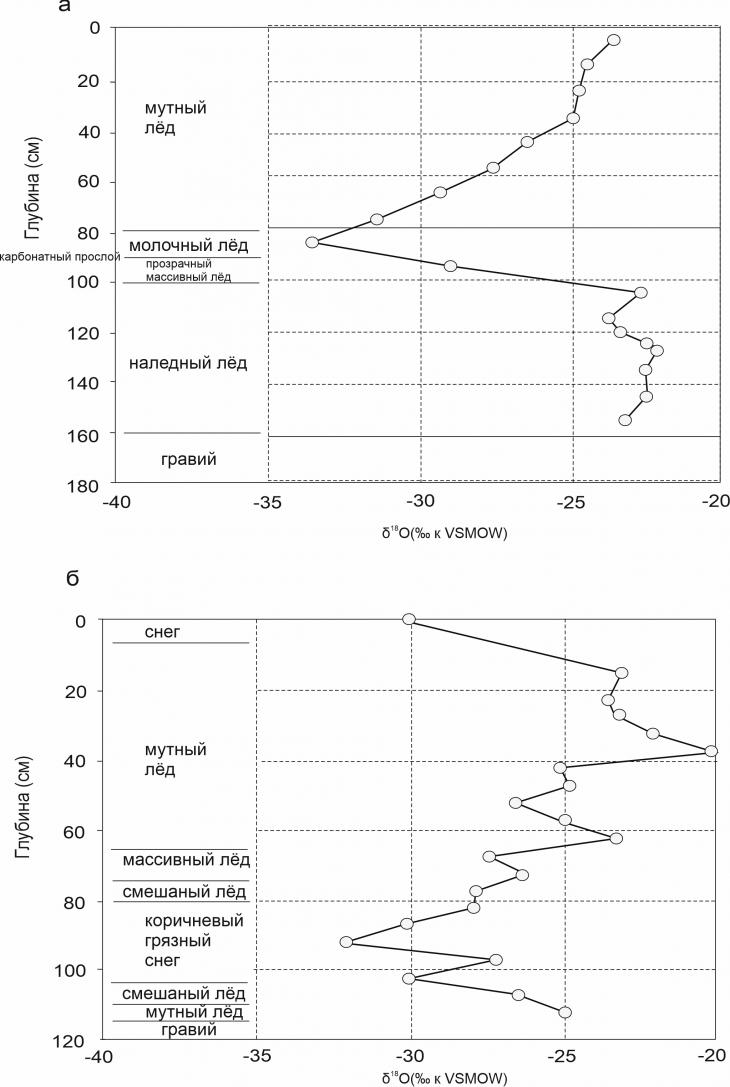
Fig. 19. Structure and isotopic composition of ice on Baylot Island, Nunavut, Canada: a – ice F192-6; b – ice IB93-5. By F.A.Michel, S.P.Paquette[46] Seasonal dome-shaped ice under the number FI92-6 (see Fig. 19, a) is located in the area of discharge of glacial waters flowing from the Fontaine and Stagnstein glaciers. Ice with a capacity of 1.6 m was selected with a 10-centimeter interval. Seasonal dome-shaped ice FI93-5 (see Fig. 19, b) is located 150 m from FI92-6. Its power ranges from 1.25 m to 2.1 m. According to F.Michael and S. Paquette[46], the isotopic composition of the ice of the ice FI92-6 (see Fig. 19, a) indicates that in the range of 0.9-1.0 m, the ice was formed in the process of freezing from bottom to top. To a depth of 0.9 m , a decrease in the values of ? 18 O is observed . Below a depth of 1 m, the values of ?18 O do not change much, averaging -22.7 ± 1. The distribution of deuterium has the same tendency. The enrichment of ice with heavy isotopes compared to the water contained in the ice occurred during the fractionation process. Comparison of the obtained data with the theoretical Rayleigh distillation curve with an equilibrium fractionation factor of 1.0028 for the ice profile FI92-6 allowed us to conclude that in the range of 0.1-0.4 m freezing was slow under equilibrium conditions (Fig. 20). 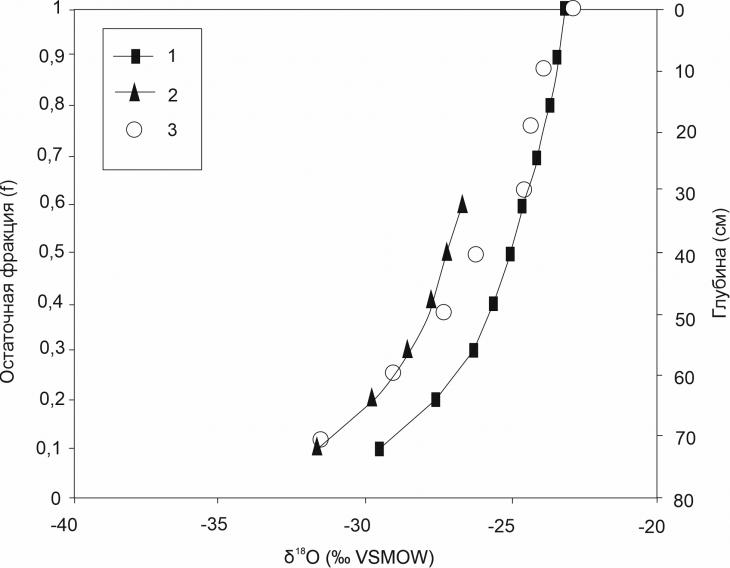
Fig. 20. Comparison of the isotopic curve of the core of ice F192-6 with the theoretical Rayleigh distillation curve with an equilibrium fractionation factor of 1.0028. From F.A.Michel, S.P.Paquette[46]: 1 – initial theoretical curve; 2 – shifted theoretical curve; 3 – ice profile F192-6 However, at that moment the ice was destroyed and lost some of the residual water. There was a negative shift in the isotopic composition for the new equilibrium curve for freezing the remaining water. The carbonate layer marked in the ice indicates that the remaining water was saturated with carbonates. The only source of carbonates in this area is groundwater from Cretaceous and Paleogene carbonate rocks. The formation of another ice IB93-5 (see Fig. 19, b) occurred according to a different scenario. The upper snow sample and a layer of dirty snow at a depth of 0.75-12.05 m has the most negative values of ?18 o. The values of ?18 O of the remaining ice range between -20.5 and -26.5, which corresponds to the average isotopic composition of the ice for this region. Isotopic profiling of ice has demonstrated that the isotopic composition of ice can be affected by the participation of groundwater, the burial of snow layers during the formation of ice, the rupture of ice with the loss of water contained in it. 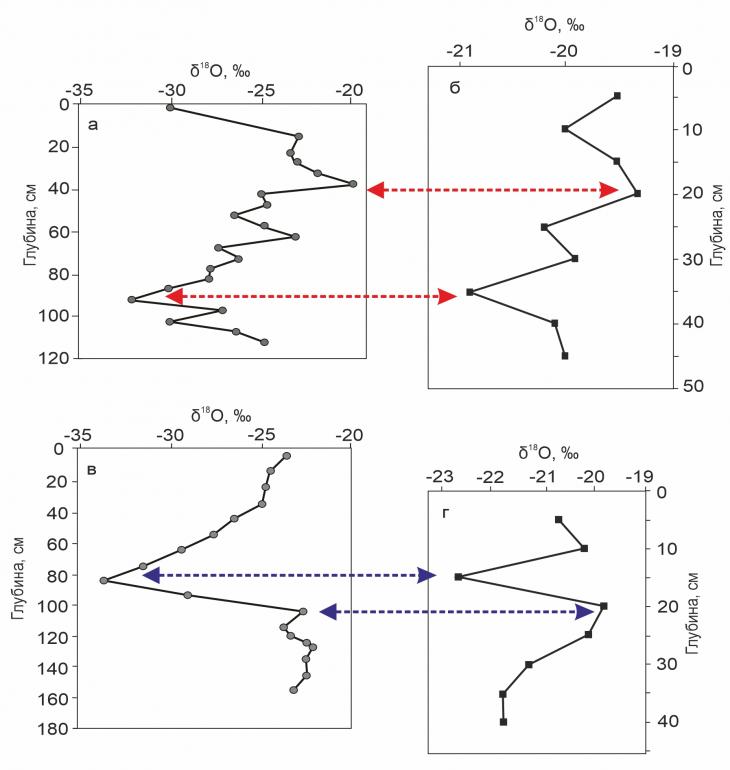
Fig. 21. Comparison: a – isotope diagram of ice 2 on Vilyue with ice diagram IB93-5 on Baylot Island from [46] and b – isotope diagram of ice 3 on Vilyue with ice diagram F192-6 on Baylot Island from [46].
It is known that during the formation of river ice in an open system with a constant inflow of water with a constant isotopic composition, the isotopic composition of the formed river ice throughout the thickness is quite constant, while the ice as a whole is more isotopically heavy relative to river water (on average by 3-4 % according to the values of ?18 O). The upper layers of ice may be more isotopically “light” as a result of the freezing of winter snow, which, as a rule, is characterized by rather low values of isotopic composition. Also, a homogeneous vertical distribution of isotopic composition values is observed in ice formed during rapid freezing of a water reservoir. However, with the slow freezing of water in a closed system, with a decrease in the volume of the water reservoir, there is a noticeable relief of the isotopic composition of the ice forming. This distribution was noted by F.Michael (Michel, 1986) for ice mounds, while he showed that the total average isotopic composition of the ice of the mounds corresponds to the average isotopic composition of the water from which the ice was formed. The sawtooth character of the isotopic curves (along with the pronounced horizontal layering) of the ice bodies studied by us shows that it is the ice, and not the ice cover of a stream or river. In addition, the similarity of the configuration of the isotope diagram of ice 1 on Vilyue with the diagram of ice IB93-5 on Baylot Island (Fig. 21, a, b) and the isotope diagram of ice 3 on Vilyue with the diagram of ice F192-6 on Baylot Island (Fig. 21, c, d) was found. variations of variations in the ice on Baylot Island are 5-6 times more than in the Vilyuya ice, one of the reasons for this is that the ice on Baylot Island is complicated by subsequent heaving. For ice 3 on Vilyui and ice F192-6 on Baylot Island, the lower fragments of the isotope curves most likely reflect the gradual freezing of the water volume from bottom to top, resulting in a weighting of the isotopic composition of the ice forming. A noticeable negative isotopic peak in the diagrams can probably indicate the outpouring of a new portion of water on the surface of the already formed ice and its gradual freezing from the bottom up. Ice on Firth River, Northern Yukon. The isotopic composition of glaciers is often associated with hydrogeological features of river basins. I. Clark and B. Lauriol[47] studied in detail the isotopic composition of glaciers in the upper reaches of the Firth River in the British Mountains on the border of Alaska and Canada (Fig. 22). The area of the Firth River basin is about 6000 km2. In the Firth River basin, two large glaciers and several small ones, confined to tributaries, were noted. Glaciers are located mainly in areas of karst distribution. The largest ice is located directly in the Firth River valley, it has a length of about 20 km, its surface area is about 32 km2, the power is 2-3 m. The second largest ice is located in the valley of Joe Creek. Its length is about 25 km, the area reaches 6.5 km2. Smaller ice floes have an area of less than 1 km2. The surface area of the ice is well correlated with the catchment area. The distribution of stable isotopes for ice in the Firth River and Joe Creek valleys demonstrates that fractionation occurred during freezing in a closed system. These data reflect the layered process of ice growth from the bottom up. The minimum content of heavy isotopes on the model curve constructed on the basis of the Rayleigh distillation equation, taking into account the enrichment factors for ice on Joe Creek (JC-1) coincides with the measured minimum. 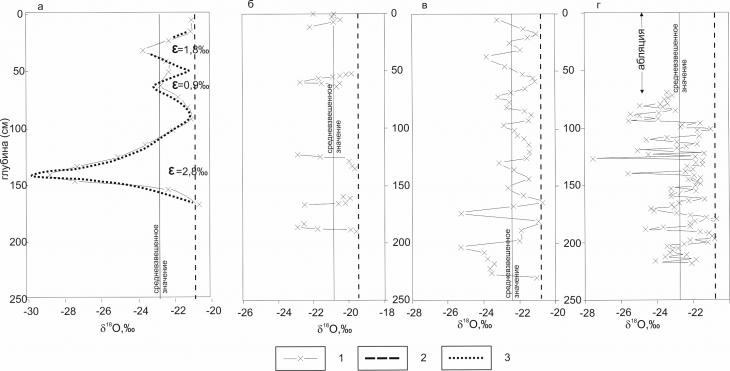
Fig. 22. Isotopic composition of the glacial ice, taking into account the value of the fractionation factor (?) for each layer. According to I.D.Clark, B.Lauriol[47]: a – ice (JC-1) on the stream. Joe (? 18 O basis= -21%, number of samples 17); b – ice (FR-1) on Firth River (? 18 O basis= -19.5%, number of samples 31), c - ice (FR-3) on Firth River (? 18 O basis= -20.8%, number of samples 44), g – ice (FR-4) on Firth River (? 18 O basis= -20.8%, number of samples 88): 1 – measured values; 2 – baseline for ? 18 O, calculated as ? 18 O basis = ? 18 O water + ? 18 O water–ice, where ? 18 O water–ice is a fractionation factor, 3 is a model curve based on the Rayleigh distillation equation taking into account enrichment factors Freezing of water is accompanied by a reduction of the oxygen isotopic composition by 2.8% of the remaining water under equilibrium conditions, although faster freezing or a thinner layer of water can significantly reduce the intensity of the fractionation process. The fractionation factor varies from 1.8 to 2.8% in the upper 50 cm of the ice section on Joe Creek (see Fig. 21, a). The central layer is the thinnest and has a minimum fractionation factor of 0.9% due to kinetic effects, while the thickest layers were frozen under equilibrium conditions. Variations of ?18 O in ice cores from the ice on the Firth River (see Fig. 22, b, c, d) reflect the accumulation of thinner layers of ice composing the ice, compared with the ice on Joe Creek and in the waters feeding the ice. Since the mass balance of isotopes is preserved during freezing, the value of ?18 O of the source water will be equal to the average value of ?18 O within the layer. Such a weighted average value was determined for each ice core. In addition, for individual values of ?18 O, the basic values were calculated as: 18 O basis = ? 18 O water + ? 18 O water-ice, where ? 18 O water-ice is the fractionation factor. The variations of ?18 O and ?2 H in the ice of the glaciers are compared with the isotopic composition of natural waters and atmospheric precipitation (Fig. 23).
Seasonal fluctuations in the content of stable isotopes observed in atmospheric precipitation are strongly smoothed out in river waters (see the tab in Fig. 23). Isotopic precipitation data fit well on the line described by the equation: 2H = 6,88(±0,21)18O ? 17,3(±5,5)‰ However, the regression coefficient in this equation is significantly lower than the one obtained by L.Cooper[48] for coastal areas of Alaska. The average values of ?18 O were used to estimate the origin of the waters that fed the ice. Frequent sampling to determine the content of stable isotopes made it possible to determine the power sources of the ice with a high degree of reliability. So the average values for FR-4 and JC-1 are very close (?18 O = -22.75 and -22.84, respectively), these are the most negative values of all obtained in this study. The glaciers are located to the south and north of the block of carbonate rocks lying within the catchment area. 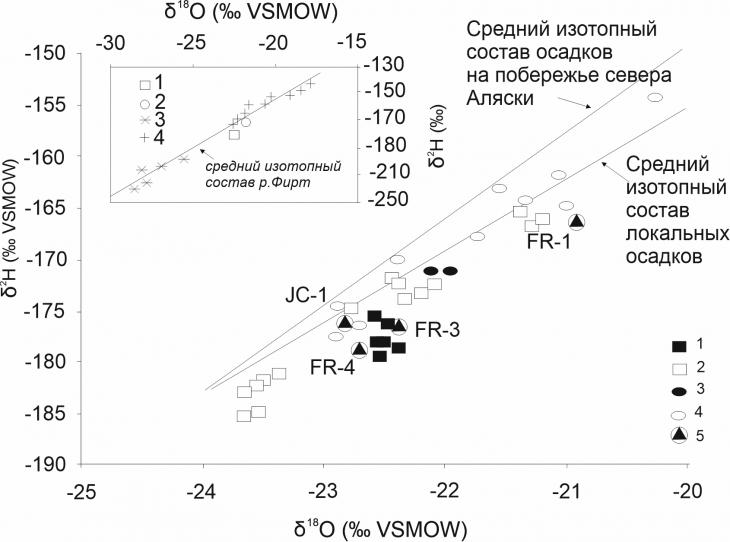
23. Isotopic composition of natural waters and glacial ice in the upper reaches of the Firth River and the basin of the Firth River. Joe Creek. According to I.D.Clark, B.Lauriol[47]: 1 – Firth River water, 2 – spring in Firth River valley, 3 – Joe Creek, 4 – spring in Joe Creek valley, 5 – ice. On the inner tab, the figures show the isotopic values of local precipitation compared to the averaged data on the water of the Firth and the creek. Joe: 1 – Firth River water, 2 – Joe Creek, 3 – snow, 4 – rain The average value for FR-3 ice (?18 O = -22.4%) is 0.3% heavier than for FR-4 ice, FR-1 ice (?18 O = -20.9%) is significantly enriched in heavy isotopes (see Fig. 23). Rivers receive ground nutrition from various aquifers. The volume of ice is about 38% of the annual groundwater flow within the basin and more than 12% of the total flow of the basin. When studying ice on Joe Creek, it was proved that a thick layer of ice is formed under nonequilibrium conditions and, consequently, the fractionation factor for a thick layer of ice is much lower [47]. D. Laselle [49] having considered the results of the study of ice on Joe Creek (Fig. 24), determined that although the ratio of deuterium and deuterium excess for ice as a whole, it has a coefficient of -0.13, for a thick layer of ice formed under equilibrium freezing conditions, this coefficient is different and is equal to -0.18. 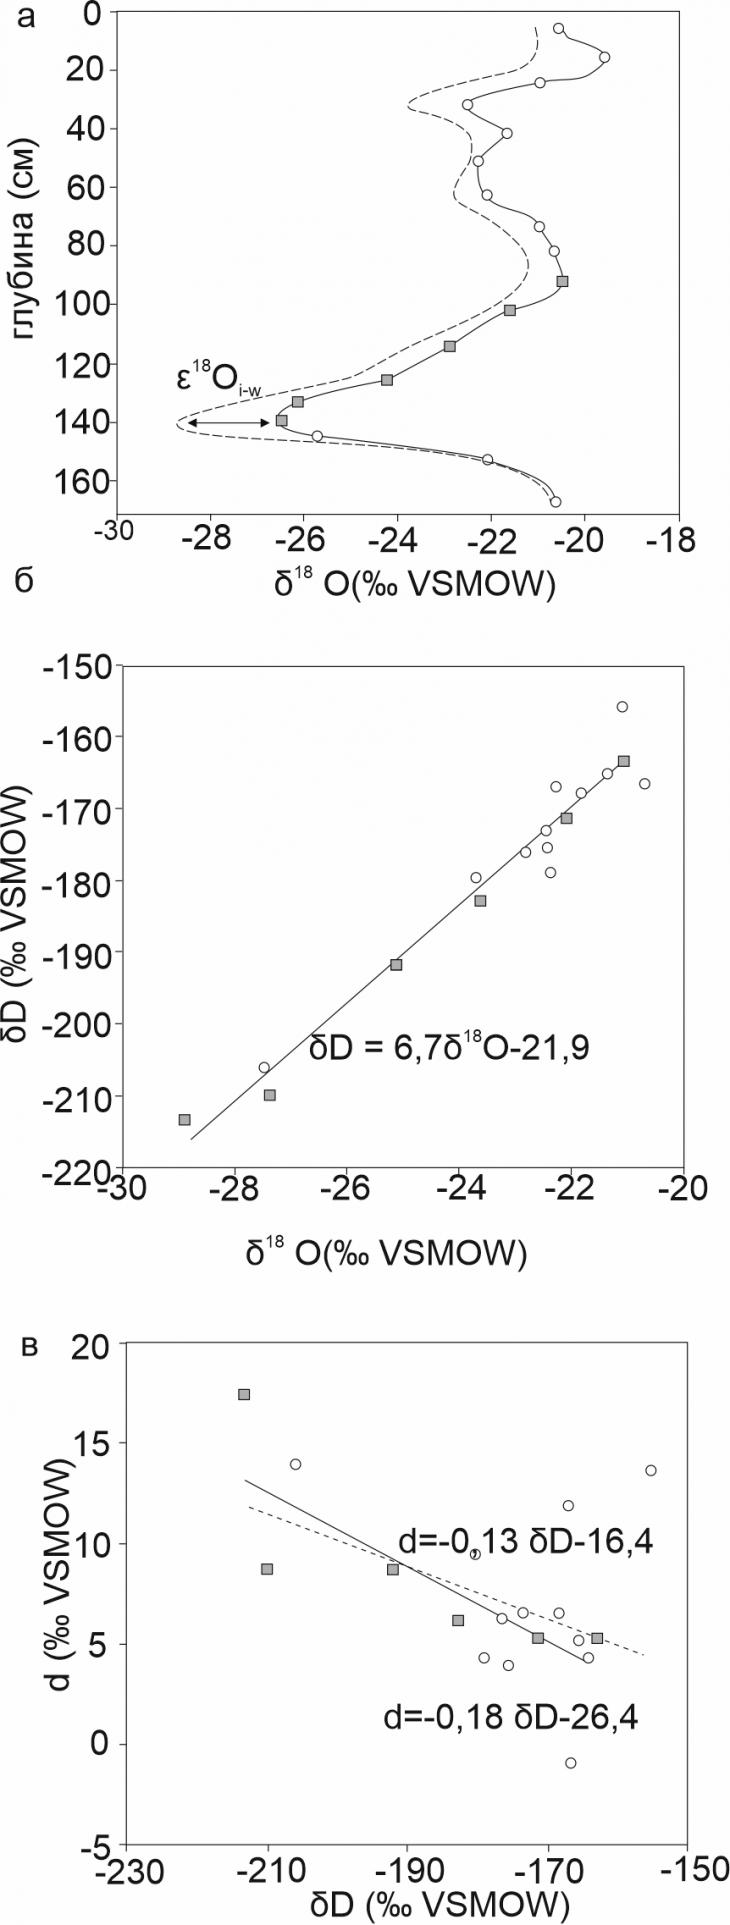
24. Isotopic composition of ice on Joe Creek, Northern Yukon. From D.Lacelle[49]: a) variations of ?18 O, the dotted line represents the theoretically calculated isotopic composition of the water from which the deposit was formed, the arrow shows the value of the fractionation factor; b) a diagram of the ratio of oxygen and deuterium isotopes; c) the diagram of the ratio of deuterium excess and deuterium, the dotted line represents the theoretically calculated isotopic composition of the water from which the deposit was formed. 1 – ice formation under non–equilibrium conditions; 2 - ice formation under equilibrium conditions Conclusion The study of the isotopic composition of ice floes allowed us to establish that: The isotopic composition of the glacial ice on the Vilyui River varies in a very narrow range: a) ice 1 – the values of ?18 O vary from -19.3 to -20.9, the values of ?2 H vary from -156.5 to – 162.9‰; b) ice 2 – the values of ?18 O vary from -19.7 to -22.4, the values of ?2 H vary from -153.2 to -173.1 ‰; c) ice 3 – the values of ?18 O vary from -19.8 to -22.7, the values of ?2 H vary from -162.9 to -181.3. Groundwater and ice formed from them are generally isotopically “lighter” compared to the surface waters of the Kysyl-Yurekh stream and the Vilyu River. Perhaps this is due to the fact that the surface water was sampled in July, when the air temperature was more than +30 ° C and the water was subjected to evaporation (which may explain the position of the points of their isotopic composition below GLMV). Enrichment in the values of ?18 O as a result of isotopic fractionation during freezing was noted in each ice, which resulted in a noticeably lower slope of the line ?2 H-?18 O, varying from 5.1 to 5.97.
The similarity of the configuration of the isotope diagram of ice 2 on Vilyuya with the diagram of ice IB93-5 on Baylot Island and the isotope diagram of ice 3 on Vilyuya with the diagram of ice F192-6 on Baylot Island was found, however, the scale of isotopic variations in the ice on Baylot Island is 5-6 times greater than in the ice of Vilyuya. Thanks The authors express great gratitude to N.V. Torgovkin, L.S. Lebedeva, A.D. Belik and E.G. Egorov for their help in organizing and conducting field work.
References
1. Alekseev V. R. Aufeis / Ed. ed. V.V. Vorobyov. Novosibirsk: Nauka, 1987.
2. Kotlyakov V.M. Selected works in six books. Book 5. In the world of snow and ice. M.: Science. 2002. 384 p.
3. Vasil'chuk Yu.K., Vasil'chuk Alla C. Isotope Ratios in the Environment. Part 1. Stable isotope geochemistry of natural ice. Textbook. Moscow: Moscow University Press, 2011.–228 p. (in Russian).
4. Kut' A.A. Eolian-permafrost formations (tukulans) of Central Yakutia: structure, genesis, age, patterns of distribution / Abstract of the dissertation for the degree of candidate of geological and mineralogical sciences. Yakutsk, 2015. 23 p. (in Russian).
5. Safronov A.F., Berzin A.G., Fradkin G.S. Tectonic nature of local uplifts of the Vilyui syneclise // Geology of oil and gas, 2003. No. 4. pp. 20–28. (in Russian).
6. State Geological Map of Russia (new series) on a scale of 1:1,000,000. Sheet P-50.51 (Olyokminsk). Map of Quaternary deposits / Committee on Geology and Subsoil Use under the Government of the Russian Federation (compiled at A.P. Karpinsky VSEGEI; authors: Rudenko T.A., Matyushkov A.D., Shurygin A.G.; cartographers-compilers: Sai T.S., Feofanova N.D.; editor Rudenko T.A.; executive editor: Kovrigina E.K. Rosgeolkom, 1992. (in Russian).
7. State Geological Map of the USSR (new series) on a scale of 1:1,000,000. Sheet Q-50.51 (Zhigansk). Map of pre-Quaternary formations / Ministry of Geology of the USSR (compiled by the Production Geological Association for the regional study of the geological structure of the country's territory "Aerogeology"; authors: Zeidler N.A., Tishchenko S.V., Leonov V.N., Natapov L.M.; executive editor: Natapov L.M. Mingeo USSR, 1990. (in Russian).
8. Pomortsev O.A., Bolshiyanov D.Yu., Popov V.F., Pravkin S.A. On the problem of marine transgressions and sedimentation environments in Central and Northern Yakutia in the Neopleistocene. Vestnik NEFU. Earth Sciences series, 2017. No. 4, pp. 5–13. (in Russian).
9. Shofman I.L., Kind N.V., Pakhomov M.M., Prokopchuk B.I., Vinogradova S.N., Sulerzhitsky L.D., Foroza V.S. New data on the age of deposits of low terraces in the basin of the river. Vilyuy // Scientific news and notes, 1976. P. 100–107. (in Russian).
10. Kokhanovsky M.A., Balykova S.D., Chernov M.S. Composition and structure of proluvial and slope sand deposits of the Vilyui river valley // Proceedings of the third All-Russian scientific and practical conference of young specialists "Engineering surveys in construction" (Moscow, April 26, 2019). Geomarketing, 2019, pp. 44–49. (in Russian).
11. Physical-geographical atlas of the World. Geomorphological map on a scale of 1:15,000,000 / Institute of Geography of the USSR Academy of Sciences: developed by I.E. Vedenskaya, editor I.P. Gerasimov, executive editor Yu.A. Meshcheryakov; Institute of Oceanology, USSR Academy of Sciences: developers V.F. Kanaev, A.S. Ionin, editors G.B. Udintseva, V.P. Zenkovich. Main Directorate of Geodesy and Cartography of the USSR State Conservatory, 1964. P. 200–201.(in Russian).
12. Alekseev M.N., Kuprina N.P., Medyantsev A.I., Khoreva I.M. Stratigraphy and correlation of Neogene and Quaternary deposits of the northeastern part of the Siberian platform and its eastern folded framing. Tr. Geol. in-ta AN SSSR, 1962. No. 66. 127 p. (in Russian).
13. Alekseev M.N., Drouchits V.A. Quaternary fluvial sediments in the Russian Arctic and Subarctic: Late Cenozoic development of the Lena River system, northeastern Siberi // Proceedings of the Geologists’ Association, 2004. No. 115. P. 339–346.
14. Pravkin S.A., Bolshiyanov D.Yu. On the problem of identifying terraces and the correlation of Quaternary deposits in the Lena Valley (on the example of the section from the mouth of the Vilyui to the mouth of the Khoruongka // Proceedings of the All-Russian Conference with International Participation VIII Shchukin Readings: Relief and Nature Management (Moscow, September 28–October 1, 2020). - in the Faculty of Geography of Moscow State University named after M.V. Lomonosov, 2020. P. 353–358. (in Russian).
15. Kolpakov V.V. Eolian Quaternary deposits of Prilenskaya Yakutia // Bulletin of the Commission for the Study of the Quaternary Period, 1983. No. 52. P. 123–131. (in Russian).
16. Pavlova M.R. Chemical and isotope composition of interpermafrost waters of dune massifs (tukulans) of the Vilyui basin (Central Yakutia) // Proceedings of the international scientific-practical conference of students, graduate students and young scientists "Geography in the modern world: century-old progress and new priorities" within the XIV Great geographical festival , April 6-8, 2018. St. Petersburg: Own publishing house, 2018. P. 58–60. (in Russian).
17. Olenchenko V.V., Gagarin L.A., Khristoforov I.I., Kolesnikov A.B., Efremov V.S. The structure of the site for the development of thermosuffusion processes within the Bestyakhskaya terrace of the Lena River according to geophysical data // Earth's Cryosphere, 2017. V. XXI. No. 5, pp. 16–26. doi: 10.21782/KZ1560-7496-2017-5(16-26). (in Russian).
18. Nikolaev A.N., Ugarov I.S. Differences in the moistening regime of permafrost landscapes in Central Yakutia and its influence on the growth of larches // Proceedings of the Samara Scientific Center of the Russian Academy of Sciences, 2011. V. 13, No. 1 (4). pp. 1016–1019. (in Russian).
19. Fedorov A.N., Vasilyev N.F., Torgovkin Y.I., Shestakova A.A., Varlamov S.P., Zheleznyak M.N., Shepelev V.V. et al. Permafrost-Lanscape Map of the Sakha (Yakutia) on Scale 1:1,500,000 // Geosciences, 2018. 8, 465. 17 p. doi:10.3390/geosciences8120465.
20. Fedorova S., Kryzhanovsky A. Combined scheme of permafrost water purification in Central Yakutia // IOP Conference Series: Materials, Science and Engineering, 2020. 953, 012025. 9 pp. doi:10.1088/1757-899X/953/1/012025.
21. Nikolaeva N.A. The stability of the landscapes of the river basin. Vilyui in Western Yakutia // Successes of modern natural sciences, 2020. No. 11. P. 88–94.(in Russian).
22. Fedorov A.N., Novopriezzhaya V.A., Fedorov N.A., Konstantinov P.Y., Samsonova V.V. Retrospective Analysis of Permafrost Landscape Evolution in Yakutia during the Holocene Warm Intervals // Land, 2020. Vol. 9, 463. 11 p. doi:10.3390/land9110463.
23. Varlamov S.P., Skryabin P.N. Dynamics of the thermal state of soils in permafrost landscapes of Central Yakutia // Proceedings of the Samara Scientific Center of the Russian Academy of Sciences, 2012. V. 14, No. 1 (8). S. 2040–2044. (in Russian).
24. Lebedeva L.S., Efremov V.S., Khristoforov I.I., Bazhin K.I., Ogonerov V.V., Pavlova N.A. Taliks and the formation of river runoff in a small catchment area in the continuous permafrost zone of Yakutia // Proceedings of the international scientific conference “Third Vinogradov Readings. Facets of Hydrology” (St. Petersburg, March 28–30, 2018), 2018, pp. 62–66.
25. Fedorov A.N. Permafrost Landscape Research in the Northeast of Eurasia // Earth, 2022. Vol. 3(1), pp. 460–478. doi:10.3390/earth3010028.
26. Vasil'chuk Yu.K. 2006. Ice Wedge: Heterocyclity, Heterogeneity, Heterochroneity. Moscow University Press; 404 pp. (in Russian).
27. Scientific and applied reference book on the climate of the USSR. Multi-year data. Yakut ASSR. Leningrad: Gidrometeoizdat, 1989. Ser. 3. K. 1. Ch. 1–6. Issue. 24. 606 p. (in Russian).
28. Vize Y.V. The climate of Yakutia. L.: Publishing House of the Academy of Sciences, 1927. 33 p. (in Russian).
29. Website "Weather and Climate". Climatic characteristics of the city of Vilyuisk. http://www.pogodaiklimat.ru/climate/24641.htm (accessed 04/22/2022).
30. Krylova A.I., Lapteva N.A. Modeling of river flow in the Lena River basin based on a hydrologically correct digital elevation model // Problems of Informatics, 2020. No. 4. 18 p. doi: 10.24411/2073-0667-2020-10016.(in Russian).
31. Yumina N.M., Tereshina M.A. Long-term changes in the runoff of rivers in the Vilyui basin // Bulletin of the Moscow University. Series 5. Geography, 2017. No. 6. P. 62–70. (in Russian).
32. Magritsky D.V. Factors and patterns of long-term changes in water runoff, suspended sediments and heat in the lower Lena and Vilyui // Bulletin of the Moscow University. Ser. 5. Geography, 2015. No. 6, pp. 85–95. (in Russian).
33. Georgiadi A.G., Kashutina E.A. Long-term changes in the annual and seasonal runoff of rivers in the Lena basin // Izvestiya RAN. Geographic Series, 2014. No. 2, pp. 71–83. (in Russian).
34. Shepelev V.V., Palova N.A. The main components of underground feeding of the rivers of Yakutia // Nauka i obrazovanie, 2014. No. 2. P. 117–120. (in Russian).
35. Shepelev V.V. On the advantages of the basin approach in studying the patterns of icing distribution // Ice and Snow, 2016. V. 56. No. 3. P. 381–386. doi:10.15356/2076-6734-2016-3-381-386. (in Russian).
36. Gabyshev V.A., Gabysheva O.I. Peculiarities of phytoplankton development and physical and chemical properties of water in the middle and lower Vilyui and the Svetlinskoye reservoir // Ecological assessment and mapping, 2011. No. 3. P. 45–54. (in Russian).
37. Chernov A.V. Vertical deformations of the crests of the lower Vilyuy rifts with changes in water levels // Proceedings of the All-Russian Scientific Conference with international participation "Modern problems of erosion, channel and estuarine processes" and the XXXI plenary interuniversity coordination meeting (Arkhangelsk, September 26–30, 2016). OOO Publishing Center A3+, 2016. P. 178–180. (in Russian).
38. Chevychelov A.P. permafrost soils of Central Yakutia: geography, genesis and diversity // Proceedings of the VII International Scientific Conference dedicated to the 90th anniversary of the Department of Soil Science and Soil Ecology of TSU "Reflection of bio-, geo-, anthropospheric interactions in soils and soil cover" (Tomsk, 14–19 September 2020). TSU Publishing House, 2020, pp. 98–101. (in Russian).
39. Vasilchuk Yu.K., Vasilchuk J.Yu., Ginzburg A.P. Cryogenic soils in the Vilyui River valley, Yakutia // Arctic and Antarctic, 2021. No. 3. P. 80–107. doi: 10.7256/2453-8922.2021.3.36671.(in Russian).
40. Classification and diagnostics of Russian soils / Compiled by: Shishov L.L., Tonkonogov V.D., Lebedeva I.I., Gerasimova M.I. Smolensk: Oikumena, 2004. 342 p. (in Russian).
41. Soil map of the RSFSR on a scale of 1:2,500,000 / All-Union Academy of Agricultural Sciences. IN AND. Lenin; Soil Institute. V.V. Dokuchaev. Chief editor: V.M. Friedland. Gosagroprom, 1988. (in Russian).
42. Okoneshnikova M.V. Composition of humus in arable soils of Central Yakutia // Vestnik SVNTs FEB RAS, 2015. No. 1. P. 37–41. (in Russian).
43. Okoneshnikova M.V. Pochvennyy pokrov na uchastke perekhoda magistral'nogo gazoprovoda cherez r. Tyung Vilyuyskogo basseyna (Yakutiya) // Vestnik KrasGAU, 2011. № 12. S. 82–86.(in Russian).
44. Dansgaard W. Stable isotopes in precipitation. Tellus. 1964. Vol. 16. P. 436–468.
45. Michel F.A. Isotope characterisation of ground ice in northern Canada // Permafrost and Periglacial Processes. 2011. Vol. 22. N1. P. 3–12.
46. Michel F.A., Paquette S.P. Icing blister development on Bylot Island, Nunavut, Canada // Permafrost, Eighth International Conference, Proceedings. Zurich, 21-25 July 2003. Eds.: by M.Philips, S.M.Springman, L.U.Arenson. Zürich, Zwitzerland. A.A.Balkema Publishers. Swets & Zeitlinger B.V. Lisse. The Netherlands. 2003. P. 759–763.
47. Clark I.D., Lauriol B. Aufeis of the Firth River basin, Northern Yukon: insights to permafrost hydrogeology and karst // Arctic and Alpine Research. 1997. Vol. 29. N2. P. 240–252.
48. Cooper L. W., Solis C., Kane D., Hinzman L. D., Application of oxygen-18 tracer techniques to arctic hydrological processes // Arctic and Alpine Research. 1993. Vol. 25. P. 247–255.
49. Lacelle D. On the δ18O, δD and d-excess relations in meteoric precipitation and during equilibrium freezing: theoretical approach and field examples // Permafrost and Periglacial Processes. 2011. Vol. 22. N1. P. 13–25.
Peer Review
Peer reviewers' evaluations remain confidential and are not disclosed to the public. Only external reviews, authorized for publication by the article's author(s), are made public. Typically, these final reviews are conducted after the manuscript's revision. Adhering to our double-blind review policy, the reviewer's identity is kept confidential.
The list of publisher reviewers can be found here.
The subject of the research in the reviewed manuscript is stable isotopes of oxygen and hydrogen in the glaciers of the Vilyui River valley. The methodology of the study is based on descriptions of field work carried out by the authors during the survey of three natural glaciers about 10 km upstream from the village of Kysyl-Syr in the Vilyuysky ulus of Yakutia, where one of the largest and most studied Aeolian permafrost formations in Central Yakutia is located - tukulan Mahatta. The relevance of the study, in the opinion of the reviewer, is due to the need to understand the mechanisms of formation of specific ice deposits, the fact that an adequate interpretation of their chemical and isotopic composition will explain the history of sediment formation. The scientific novelty of the presented study, according to the reviewer, consists in the quantitative determination of stable isotopes of oxygen and hydrogen in the glaciers of the Vilyu River valley. The following sections are structurally highlighted in the article: Introduction, Physical and geographical conditions of the research area, Objects and methods Studied on the ice, Field sampling of ice ice, Laboratory isotope studies of ice ice, Results, Discussion, Conclusion, Acknowledgements, Bibliography. The introduction highlights the general issues of ice formation in areas of severe climate in severe winter frosts, including coastal ice, which are formed as a result of wave-breaking activity of water flows, tides, groundwater discharge in outcrops and usually form an ice cascade of shafts up to 3 m thick; it is said about the territories where the ice is located. The main part of the text of the article talks about the geographical location of the research area, provides a stratigraphic diagram of the section of sediments of the Cretaceous and Neogene systems through the valley of the Vilyui River near the village of Kysyl-Syr; describes the relief, climate, soil cover of the territory and permafrost; provides photographs of re-vein ice and their host sediments exposed in the outcrop the actively collapsing high left bank of the Vilyui River. The authors note that in the area of the middle course of the Vilyui, the ratio of the total area of ice to the total area of the river basin is 0.01-0.05. The following is a description of each of the three surveyed glaciers, it is explained why the studied objects are precisely glaciers, and not thawing areas of river ice, the sampling process is described in detail, it is said where on what equipment and according to what standards laboratory isotope studies of ice were carried out. Of particular interest to specialists may be the quantitative values of stable oxygen and hydrogen isotopes at different depths in the ice of the glaciers in the valley of the Vilyui River, as well as in surface and groundwater. The article compares the isotopic composition obtained by the authors with the results of research by other scientists in various territories.In conclusion, the results of the study are summarized, it is noted that groundwater and the ice formed from them are generally isotopically “lighter” compared to the surface waters of the Kysyl-Yurekh stream and the Vilyu River. Perhaps this is due to the fact that the surface water was taken in July, when the air temperature was more than +30 ° C and the water was subjected to evaporation. The bibliographic list includes 49 sources, each of which has an address link in the text, which indicates the presence of an appeal to opponents in the publication. In general, the content and style of presentation of the material corresponds to the practice of publications that has developed in the design of the results of scientific research. Based on the presented materials, I would like to express a wish: to reflect the pursued purpose and objectives of the study, as well as its practical significance in a form accessible to a wide range of readers. The relevance of the topic of the article, its correspondence to the subject of the journal "Arctic and Antarctic", the presence of elements of increment of scientific knowledge indicate the possibility of publishing a peer-reviewed article.
|

 Eng
Eng