|
Finance and Management
Reference:
Gordienko, M.S., Popkov, V.A. (2022). Development of a system of financial risk indicators based on logistic regression and the CorporateMetrics methodology. Finance and Management, 1, 9–30. https://doi.org/10.25136/2409-7802.2022.1.36057
Development of a system of financial risk indicators based on logistic regression and the CorporateMetrics methodology
Gordienko Mikhail Sergeevich
PhD in Economics
Docent, the department of Financial Management, Plekhanov Russian University of Economics
117997, Russia, g. Moscow, per. Stremyannyi, 36

|
gordienkomikhail@yandex.ru
|
|
 |
Other publications by this author
|
|
|
Popkov Vladislav Andreevich
Master's Degree, Department of Financial Management, Plekhanov Russian University of Economics
117997, Russia, g. Moscow, per. Stremyannyi, 36
|
|
chernoshevskiy@gmail.com
|
|
|
|
DOI: 10.25136/2409-7802.2022.1.36057
Received:
03-07-2021
Published:
03-04-2022
Abstract:
Business entities in their practical activities are constantly faced with the presence of various risks, manifested in the negative impact on them of factors of both internal and external environment. The most important for any financial manager are financial risks (market, credit, fiscal, currency, etc.), the management skills of which in a crisis period reveals genuine professionals in their field. To simplify the management process, algorithms or models are being developed that allow increasing the efficiency and speed of the management decision-making process. The subject of this study is the development of a methodology for assessing and forecasting financial risks. The purpose of the development is to simplify the process of selecting mechanisms for influencing risk, which allows maintaining the stability of cash flows over time and achieving the target financial indicators of an economic entity. The research methodology is based on the use of a combination of logistic regression tools and the CorporateMetrics methodology. These systems of financial risk indicators are highly sensitive to changing market conditions due to unfixed thresholds determined by the average values of the indicators used by the industry. The novelty of the study lies in the fact that the joint use of various indicators and indicators allows to comprehensively assess the exposure of an organization to each type of financial risk and monitor changes in the values of risk indicators. The scope of application of the results is presented on the example of the evaluation of open data on the economic activity of MTS PJSC for the period 2016-2018, the mechanism of using the methodology is shown. It is worth noting that the ability to adapt the indicators and indicators used in the methodology allows it to be applied to any economic entity of the non-financial sector of the economy.
Keywords:
finance, corporate finance, risk, financial risk, market risk, credit risk, indicator system, logistic regression, CorporateMetrics, MTS
This article is automatically translated.
You can find original text of the article here.
Despite the presence of risk in almost any field of activity, currently there is still no generally accepted definition of the term "risk". Let's consider the positions of modern economists in relation to the category of "risk". A group of Western researchers: Michel Krui, Dan Galay and Robert Mark, consider risk as an unforeseen occurrence of expenses or losses, the coverage of which requires the use of reserves created for expected costs [1]. Risk is considered by economists as a negative phenomenon that entails measurable damage. A different position is held by a modern American scientist, Professor of New York University Aswat Damodaran, who considers risk as the probability of income deviation from the expected value. At the same time, the risk includes not only unfavorable outcomes (downside risk), but also favorable outcomes (upside risk) [2]. From this point of view, there is a duality of risk, which consists in the ability to lead to both negative and positive consequences. Another definition of the term "risk", which is given in the risk management standard. According to the standard: ISO 31000:2018(E), risk refers to the impact of uncertainty on goals [3]. The document explains: influence is a deviation from the expected, which can be both positive and negative, and goals can have different aspects and categories and can be applied at different levels. The Standard identifies three significant aspects when defining the term "risk". Firstly, the risk arises when there is a situation of uncertainty about the future outcome. Secondly, the dual nature of risk is emphasized, which was indicated by A. Damodaran in his definition. Thirdly, central attention is paid to the set goals, the achievement of which is of particular importance for the organization. Since there are broad limits to the interpretation of the understanding of "risk", detailed classifications according to various criteria are used to identify specific risks, but they are united by the fact that to varying degrees they ultimately affect the financial condition of the company. At the same time, there is such a category as financial risk – the probability of a change in the qualitative state of the company's assets as a result of financial decisions made by the managing link in the course of business activities. This category includes: credit risk; currency risk; investment risk; innovation risk; liquid risk; market risk, etc. In other words, financial risk is understood as the possibility of deviation of the liquidity and value of the assets of the organization from the expected values as a result of the impact of market factors or non-fulfillment of financial obligations. From the classification of types of financial risks of non-financial organizations, we will consider in more detail: liquidity risk, credit and market risks [4], which will be used as markers of the financial condition of the company in the future, we will give a definition. There are two similar in name, but different in content of liquidity risk: - market liquidity risk – the risk associated with a negative deviation of the actual value of transaction costs from the expected one due to low market liquidity; - the risk of balance sheet liquidity is the insufficiency of the organization's cash or highly liquid assets to fulfill its own obligations to counterparties. Credit risk is the possible incurring of losses due to the inability of an economic entity to fulfill its contractual obligations. The extreme manifestation of credit risk is expressed in the form of bankruptcy. Credit risk is divided into counterparty risk associated with the ability of a particular borrower to repay its obligations, and the organization's own credit risk, expressed in the form of financial insolvency. Market risk is the possibility of deviation of the actual value of an asset from the expected value due to the action of market factors. When determining the constituent subspecies of market risk, a classification by market segments is used, according to which [5] are distinguished: interest rate, currency, commodity and stock risks. In order to improve the efficiency of financial risk management, their continuous monitoring is carried out. For this purpose, risk indicators are used – quantitative indicators with high sensitivity, the values of which reflect the probability of an adverse event. Let's consider the indicators for the previously identified types of financial risk. To assess the risk of balance sheet liquidity, coefficient analysis is most often used – relative indicators are calculated. For each indicator, a threshold value is determined, the excess or underestimation of which signals the possibility of adverse consequences. The risk assessment of the balance sheet liquidity can be carried out by calculating the liquidity ratios presented in Table 1 and comparing the values obtained with the standards. To assess credit risk, we will consider its two components: the risk associated with counterparties and our own credit risk. The exposure to the counterparty's general credit risk is signaled by the high proportion of reserves for doubtful debts in the total amount of accounts receivable. A provision for doubtful debts is created when overdue receivables arise and is reflected in the balance sheet in the item "other expenses". Qualitative and quantitative methods are used to assess the own credit risk expressed by the recognition of the financial insolvency of the organization. Qualitative methods are applied to each organization, but they act as an auxiliary group of methods. The group of quantitative methods includes methods based on absolute and relative indicators of financial condition assessment. Since the second half of the twentieth century, thanks to the development of computing technologies, methods based on the analysis of statistical data have been used. Among these methods, logistic models of bankruptcy forecasting are distinguished [6]. Table 1. Balance sheet liquidity ratios [7]
| Indicator | Formula | Standard | Explanation | | Absolute liquidity ratio | 
| 0,2-0,5 | It shows the share of short-term liabilities covered by absolutely liquid assets. At the same time: if the value <0.2 indicates the difficulty of immediate fulfillment of obligations at the expense of highly liquid assets; >0.5 - an irrational capital structure, the presence of idle cash. A1 - the most liquid assets; P1 - the most urgent liabilities; P2 - short-term liabilities. | | Quick Liquidity ratio | 
| 0,7-1 | Shows the extent to which short-term liabilities are covered by the most liquid and quickly realized assets. A value of <0.7 indicates the difficulty of repayment of short-term obligations; >1 indicates good solvency. A2 - fast-selling assets. | | Current liquidity ratio | 
| 1-3 | Shows how many rubles of current assets account for one ruble of current liabilities. The value of 3 indicates an irrational capital structure. A3 – slow-selling assets. | Logistic regression is used to predict the probability of occurrence of some event based on the values of a set of features. The peculiarity of the logit model is that the final indicator takes a range of values in the form of the probability of a binary event (1 or 0). This contributes to a simpler perception of the results obtained than in parametric models, in which the final indicators may have a strong numerical variation in values. In 2009, G.A. Khaidarshina developed an eleven-factor logit model to assess the probability of bankruptcy risk for 4 different industries. Table 2 shows the parameters of the model. The formula has the form [8]:
 (1) (1)
where: C is a complex criterion of bankruptcy risk; e is the Euler number, a mathematical constant equal to 2.71828; y is a regression equation defined by the formula:  (2) (2)
where:  , ,  – numerical coefficients of the model; – numerical coefficients of the model;  – regression parameters. – regression parameters. Table 2. Logit model parameters. | Ratio | Calculation formula | | 
| Balancing coefficient that characterizes the age of the organization: "1" if the company was established less than 10 years ago; "0" if the company was created more than 10 years ago. | | 
| Balancing coefficient that characterizes the credit history of the organization: "1" if the credit history cannot be assessed as "positive"; "0" if there is a positive credit history. | | 
| Current liquidity ratio | | 
| 
| | 
| 
|
| 
| Refinancing rate (key rate since 2016) of the Bank of Russia | | 
| Balancing coefficient characterizing territorial affiliation: "1" if the organization operates in other regions; "0" if the organization operates in Moscow or St. Petersburg. | | 
| 
| | 
| 
| | 
| The growth rate of equity | | 
| Asset growth rate | | KiR – equity, PE – net profit, EBIT – profit before interest and taxes. | The matrix of the coefficients of the model depends on the industry segment to which the organization in question belongs. Table 3 shows the values of the logit model coefficient matrix, and table 4 shows its criteria for assessing the probability of bankruptcy. Table 3. Values of the logit model coefficient matrix by industry segments | Ratio | Industry segment | | Industry | TEK |
Trading | Agricultural industry | |
| 10,2137 | 30,7371 | 35,0326 | 13,5065 | |
| 0,0303 | 3,7033 | 4,1834 | 0,2753 | | 
| 6,7543 | 8,9734 | 9,0817 | 6,6637 | | 
|
-3,7039 | -8,6711 | -8,7792 | -7,0113 | | 
| -1,5985 | -7,011 | -8,5601 | -2,3915 | | 
| -0,564 | -1,6427 | -1,6834 | -1,0028 | | 
| -0,1254 | -0,1399 | -0,4923 | -0,29 | |

| -1,3698 | -0,6913 | -0,8023 | -1,5742 | | 
| -6,3609 | -5,0894 | -8,4776 | -6,1679 | | 
| -0,2833 | -15,3882 | -10,8005 | -2,3624 | | 
| 2,5966 | 7,3667 | 7,1862 |
2,8715 | | 
| -7,3087 | -22,0294 | -22,7614 | -6,9339 | Table 4. Criteria for assessing the probability of bankruptcy of the logit model by G. A. Khaidarshina | The value of the final indicator | Probability of bankruptcy | | 0 – 0,2 | Minimum | | 0,2 – 0,4 | Low | | 0,4 – 0,6 | Average | | 0,6 – 0,8 | High | | 0,8 – 1 | Maximum |
One of the most common market risk measurement methodologies in practice is the "CorporateMetrics" assessment system based on the Value-at-Risk concept, which is based on the financial results of the company. The CorporateMetrics assessment system is designed for organizations in the non-financial sector and is used to calculate the possible difference between the expected values of financial performance indicators and the predicted ones that an organization can receive under the influence of market risk. The process of assessing the financial result indicator taking into account the risk consists of several stages [9]. At the first stage, the financial indicator, the time horizon of forecasting and the confidence interval are selected. At the second stage, market indicators that affect the value of the financial result are reflected. At the third stage, the characteristics of the distribution of the model parameters are determined. At the fourth stage, random parameter values are generated and a histogram of the obtained values of the financial indicator is constructed. At the fifth stage, a financial indicator is calculated based on the histogram, taking into account the risk. The calculation of the risk profit indicator  with a 95% confidence interval is the difference between the expected value of the indicator and the 5% quantile: with a 95% confidence interval is the difference between the expected value of the indicator and the 5% quantile:  (3) (3)
where:  – revenue with risk; – revenue with risk;  – expected revenue; – expected revenue;
 – the quantile value corresponding to the 5% level. – the quantile value corresponding to the 5% level.
Having determined the methods of forecasting and assessing financial risks, we will further consider the issue of the exposure of telecommunications industry organizations to financial risks on the example of MTS PJSC. The main source of revenue of MTS PJSC is three areas [10, 11]: mobile services (70-74% of revenue), fixed services (13-15% of revenue), sale of goods (12-15% of revenue). Figure 1 shows the dynamics of the structure of profit from sales. 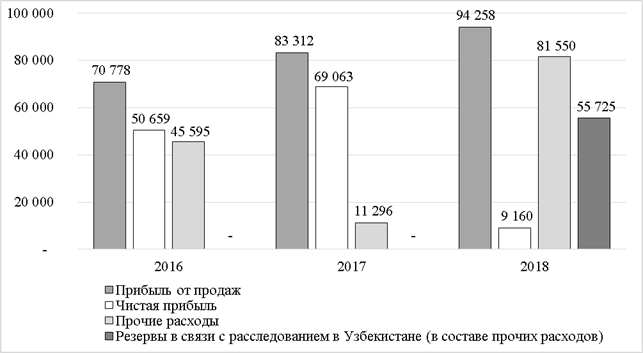
Figure 1. Dynamics of changes in the structure of profit from sales of MTS PJSC for 2016-2018 in millions of rubles [12, 13] A significant share of the Company's consolidated revenue falls on the Russian market for reasons of greater capacity and duration of operations. The peculiarity of companies in the telecommunications industry is the large share of borrowed capital in the amount of total capital. Figure 2 shows the dynamics of the ratio of equity to the total capital of the main companies of the Russian telecommunications market for the period 2016-2018. 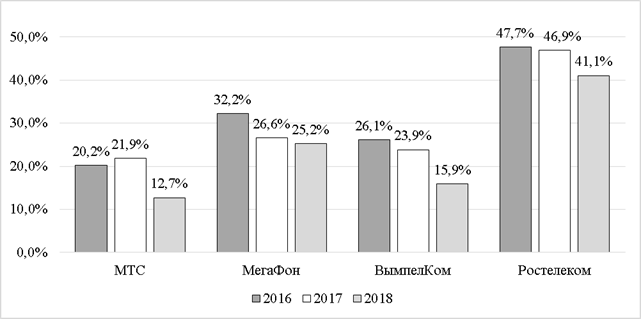
Figure 2. Dynamics of the ratio of equity capital to the total amount of capital of Russian telecommunications companies for the period 2016-2018, in % [14-19] These diagrams allow us to draw a number of conclusions: 1. The peculiarity of the telecommunications services market is the high share of borrowed capital in the amount of total capital. This is due to the large capital expenditures required to purchase licenses and permits to carry out activities, create the necessary technological infrastructure, and implement digital solutions. 2. Companies mainly engaged in the mobile services segment have a larger share of borrowed funds than in the fixed-line segment. 3. There is an increase in the share of borrowed funds in the telecommunications industry market, which may be a reflection of the long-term stagnation in the Russian mobile services market, the trend of a reduction in the fixed telephony market, and the implementation of expensive investments. 4. Among the main companies considered in the Russian telecommunications market, MTS PJSC has the highest share of borrowed capital, which may indicate a decrease in solvency. An analysis of the specific features of the business activities of telecommunications companies and, in particular, MTS PJSC shows that these organizations are exposed to a large number of risks, including financial ones. This is due to the need to attract borrowed funds to maintain the core business, on the one hand, on the other hand, it is the result of the diversification of the market for services and the activities of companies in various economic conditions. As shown in Figure 2, telecommunications companies use a significant share of borrowed funds, which are serviced on different terms. As can be seen from the accounting reports, a large share of borrowed funds falls on long-term liabilities.
Short-term liabilities have a smaller share in the structure of borrowed funds, but for MTS PJSC they exceed the amount of own funds, which is shown in Figure 3. Therefore, the Company faces a risk of balance sheet liquidity, during the implementation of which it may be difficult to repay current liabilities. An imbalance in the capital structure and a violation of the liquidity of the balance sheet of MTS PJSC expose the organization to the risk of financial insolvency. This risk is expressed in the inability to pay off creditors for the obligations assumed, the sale of their own property and the recognition of bankruptcy. 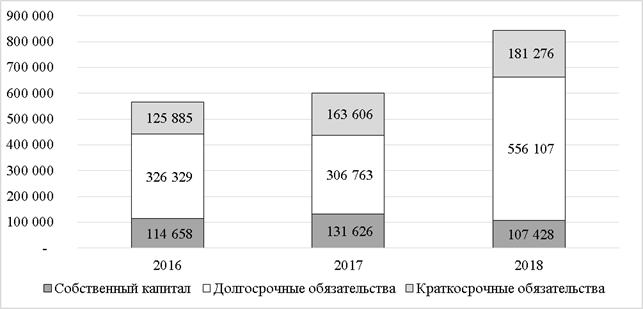
Figure 3. Dynamics of the capital structure of MTS PJSC for 2016-2018, in million rubles [17, 18] Market risks play an important role in the current activities of the organization. Given the wide diversification of MTS PJSC's sales markets, the Company is exposed to currency risk, which may manifest itself when making currency settlements with subsidiaries or counterparties located outside Russia. Thus, analyzing the activities of MTS PJSC in 2016-2018, it was revealed that the Company is exposed to financial risks, most of which can lead to negative consequences in the form of a drop in the value of the final financial result, a decrease in the liquidity of the balance sheet and solvency, the formation of barriers that impede access to borrowed capital. Below is a system of financial risk indicators, the results of which assessment can become the basis for making effective management decisions. To assess the exposure to the risk of balance sheet liquidity, it is proposed to use the liquidity ratios presented in Table 1 as indicators of financial risk. To determine the value of the balance sheet liquidity risk indicator, the formula (4) is proposed, according to which if the indicator  in the period under review takes a value less than the industry average in the current period in the period under review takes a value less than the industry average in the current period , or a value less than the industry average for the entire period under review , or a value less than the industry average for the entire period under review , then the indicator , then the indicator  signals an unsatisfactory indicator value. Otherwise, the indicator takes a satisfactory value: signals an unsatisfactory indicator value. Otherwise, the indicator takes a satisfactory value:  (4) (4)
where:  – the value taken by the indicator; – the value taken by the indicator;  – liquidity ratio in the period t; – liquidity ratio in the period t;
 – the average industry value of the liquidity ratio in the period t; – the average industry value of the liquidity ratio in the period t;
 – the average industry value of the liquidity ratio for the entire period under review; – the average industry value of the liquidity ratio for the entire period under review;
t is the current time period; i is the index of the indicator: the coefficient of absolute, rapid or current liquidity. A medium-term period of three years is set as the time period under consideration, since the activities of large organizations during this period are not subject to strong fluctuations. In turn, the comparison of industry averages for a particular year and for the entire period is carried out to reduce the impact on the assessment of risk exposure to random factors and the error of averaging. The indicator for assessing the counterparty's overall credit risk is the ratio of reserves for doubtful debts on accounts receivable to the total amount of accounts receivable. The formula (5) is proposed:  (5) (5)
where: – the value taken by the indicator;  – the ratio of the allowance for doubtful debts to the total amount of accounts receivable in the period t; – the ratio of the allowance for doubtful debts to the total amount of accounts receivable in the period t;
 – the average industry value of the ratio in the period t; – the average industry value of the ratio in the period t;
 – the average industry value of the ratio for the entire period under review; – the average industry value of the ratio for the entire period under review;
t is the current time period.
The value of risk indicators for financial stability coefficients is determined by the formula (4), in which – the considered indicator of financial stability in period t, – the average industry value of the indicator in period t,  – the average industry value of the indicator of financial stability for the entire period under review. – the average industry value of the indicator of financial stability for the entire period under review. According to the financial insolvency forecasting model, risk indicators take values in accordance with the criteria. This condition is expressed by the formula (6):  (6) (6)
where: – indicator value;  – the actual value of the final indicator; – the actual value of the final indicator;
 – the critical value of the final indicator. – the critical value of the final indicator.
Since part of the organization's revenue and expenses is denominated in foreign currency, or depends on fluctuations in foreign exchange rates relative to the ruble, the CorporateMetrics methodology is used as an indicator of exposure to currency risk. The quantitative indicator is the ratio of revenue at risk to the forecasted value of revenue. The value of the currency risk indicator is determined by the formula (7):  (7) (7)
where:  – indicator value; – indicator value;  – risk-adjusted revenue; – risk-adjusted revenue;
 – expected revenue value; – expected revenue value;
 – the limit of the ratio of revenue, taking into account the risk to the expected value of revenue. – the limit of the ratio of revenue, taking into account the risk to the expected value of revenue.
In order to calculate the effectiveness of the proposed system of financial risk indicators, based on the best available information, calculations of financial risk indicators were carried out on the example of MTS PJSC. The basis for the calculations performed was the data contained in the annual accounting reports of MTS PJSC. To calculate the balance sheet liquidity risk indicators for the industry, the grouping of assets and liabilities of the balance sheet of MTS PJSC, MegaFon PJSC, VimpelCom PJSC and Rostelecom PJSC for 2016-2018 was carried out. Assets are grouped according to the degree of liquidity, and liabilities are grouped according to the urgency of repayment of obligations. The results of the grouping are shown in Table 5. Table 5 Grouping of assets and liabilities of the balance sheet of MTS PJSC, MegaFon PJSC, VimpelCom PJSC and Rostelecom PJSC for 2016-2018, in millions of rubles | Group of articles | 2016 | 2017 | 2018 | | MTS PJSC | | A1 |
16 071 | 70 841 | 105 143 | | A2 | 30 449 | 37 121 | 35 527 | | A3 | 505 | 376 | 460 | | A4 | 519 847 | 493 657 | 703 681 | | P1 | 60 224 |
72 292 | 113 720 | | P2 | 63 454 | 88 710 | 67 556 | | P3 | 326 329 | 306 763 | 556 107 | | P4 | 116 865 | 134 230 | 107 428 | | Balance | 566 872 | 601 995 |
844 811 | | PJSC MegaFon | | A1 | 45 569 | 30 448 | 35 417 | | A2 | 28 438 | 43 696 | 52 140 | | A3 | 2 019 | 1 827 | 962 | | A4 | 388 593 | 407 095 | 493 543 |
| P1 | 39 500 | 48 065 | 53 891 | | P2 | 37 733 | 51 235 | 36 754 | | P3 | 219 845 | 238 158 | 328 911 | | P4 | 167 541 | 145 608 | 162 506 | | Balance | 464 619 |
483 066 | 582 062 | | PJSC "VimpelCom" | | A1 | 26 629 | 59 469 | 34 677 | | A2 | 44 188 | 47 332 | 35 545 | | A3 | 6 679 | 3 565 | 9 083 | | A4 | 336 502 |
280 465 | 266 758 | | P1 | 42 776 | 47 806 | 70 906 | | P2 | 102 688 | 31 430 | 14 232 | | P3 | 160 255 | 218 320 | 205 786 | | P4 | 108 280 | 93 275 | 55 139 |
| Balance | 413 998 | 390 831 | 346 063 | | Rostelecom PJSC | | A1 | 9 582 | 7 989 | 14 844 | | A2 | 50 989 | 54 590 | 60 783 | | A3 | 5 892 | 5 996 | 7 132 | | A4 |
496 033 | 500 300 | 519 927 | | P1 | 67 560 | 70 478 | 97 115 | | P2 | 68 295 | 32 709 | 42 367 | | P3 | 162 245 | 201 815 | 211 407 | | P4 | 264 396 |
263 873 | 251 797 | | Balance | 562 496 | 568 875 | 602 686 | Table 6 shows the indicators of the main telecommunications companies, on the basis of which the calculations of the average values of indicators for the industry were carried out. To compare the liquidity indicators of MTS PJSC's balance sheet with the industry averages, data from the annual accounting reports of the main Russian telecommunications companies were taken: PJSC MegaFon, PJSC VimpelCom and PJSC Rostelecom. The calculated indicators are shown in Table 7. Table 6. The values of the balance sheet liquidity ratios for MTS PJSC, MegaFon PJSC, VimpelCom PJSC and Rostelecom PJSC for 2016-2018 | Indicator | 2016 | 2017 | 2018 | | MTS PJSC | | Absolute liquidity ratio | 0,130 | 0,440 | 0,580 | | Quick Liquidity ratio | 0,376 |
0,671 | 0,776 | | Current liquidity ratio | 0,380 | 0,673 | 0,779 | | PJSC MegaFon | | Absolute liquidity ratio | 0,590 | 0,307 | 0,391 | | Quick liquidity ratio | 0,958 | 0,747 | 0,966 | | Current liquidity ratio | 0,984 | 0,765 | 0,977 | | PJSC "VimpelCom" | | Absolute liquidity ratio |
0,183 | 0,751 | 0,407 | | Quick Liquidity ratio | 0,487 | 1,348 | 0,825 | | Current liquidity ratio | 0,533 | 1,393 | 0,931 | | Rostelecom PJSC | | Absolute liquidity ratio | 0,071 | 0,077 | 0,106 | | Quick Liquidity ratio | 0,446 | 0,606 | 0,542 |
| Current liquidity ratio | 0,489 | 0,665 | 0,593 | Comparison of industry averages with regulatory values indicates that the industry averages of absolute and rapid liquidity ratios correspond to the range of regulatory values. However, for the entire industry, the value of the current liquidity ratio is below the standards. Table 7. MTS PJSC balance sheet liquidity indicators and industry averages for 2016-2018 | Indicator | 2016 | 2017 | 2018 | Range of normative values | The average value of the industry for the entire period | | Absolute liquidity ratio | 0,130 | 0,440 | 0,580 | 0,2-0,5 | 0,334 | | Industry average | 0,243 | 0,394
| 0,371 | | Quick Liquidity ratio | 0,376 | 0,671 | 0,776 | 0,7-1 | 0,720 | | Average industry value | 0,567 | 0,843 | 0,777 | | Current liquidity ratio | 0,380 | 0,673 | 0,779 | 1-3 | 0,753 | | Average industry value | 0,597 | 0,874 |
0,820 | Based on formula (4), the values of the balance sheet liquidity risk indicators by liquidity ratios are determined. The results are presented in table 8. Table 8. Values of MTS PJSC's balance sheet liquidity risk indicators by liquidity ratios for 2016-2018 | Indicator | 2016 | 2017 | 2018 | | Absolute liquidity ratio | Bad luck. | Udov. | Udov. | | Quick Liquidity ratio | Bad luck. | Bad luck. | Udov. | | Current liquidity ratio | Bad luck. | Bad luck. | Udov. | At the beginning of 2019, all MTS PJSC balance sheet liquidity risk indicators are in a satisfactory zone, meaning that all liquidity values correspond to or exceed industry averages. When assessing the counterparty's exposure to credit risk, the ratio of reserves for doubtful debts and the total amount of accounts receivable was used. Table 9 shows the results of the evaluation.
Table 9. Indicators of reserves for doubtful debts and receivables for MTS PJSC and the entire industry for 2016-2018 | Indicator | 2016 | 2017 | 2018 | | Provisions for doubtful debts | 2037 | 3136 | 1830 | | Accounts receivable | 26623 | 32647 | 30502 | | Provisions for accounts receivable | 7,65% | 9,61% | 6,00% | | Average industry value | 7,77% | 6,48% | 7,67% |
| Average industry value for the entire period | 7,26% | | | | Indicator value | Udov. | Bad luck. | Udov. | In general, there is a high level of payment discipline of counterparties with which the Company cooperates, which indicates a low exposure to the counterparty's overall credit risk. Table 10 shows calculations for predicting the financial insolvency of organizations using the logit model. Table 10. Forecasting bankruptcy according to the logit model by G. A. Khaidarshina | Factor | 2018 | 2017 | 2016 | | №1 | 0 | 0 | 0 | | №2 | 0 | 0 |
0 | | №3 | 0,779 | 0,673 | 0,380 | | №4 | 1,615 | 3,681 | 2,968 | | №5 | 11,585 | 11,788 | 11,650 | | №6 | 7,75% | 7,75% | 10,00% | | №7 | 0 | 0 |
0 | | №8 | 0,011 | 0,115 | 0,089 | | №9 | 0,085 | 0,525 | 0,442 | | №10 | -0,184 | 0,148 | 2,230 | | №11 | 0,403 | 0,062 | 0,056 | | y | -16,679 | -29,249 |
-4,151 | | C | <0,001% | <0,001% | 1,551% | | | | Additional information: | | Indicator | 2018 | 2017 | 2016 | | EBIT | 53 331 | 112 726 | 93 478 | | The Central Bank's key rate | 7,75% | 7,75% | 10,00% | Table 11 shows the results of the evaluation. When calculating the values, data from the Bank of Russia [20] and Rosstat [21] were used. Table 11. Estimates of bankruptcy forecasting by logit models
| Model | 2016 | 2017 | 2018 | | G. A. Khaidarshina | 1,551% | >0,001% | >0,001% | | Indicator value | Udov. | Udov. | Udov. | The obtained evaluation results indicate a low probability of bankruptcy of MTS PJSC. The result of the applied bankruptcy forecasting model indicates a significant disproportion in the capital structure, in which there is a preponderance towards long-term liabilities. In the medium term, the Company does not expect recognition of financial insolvency, as evidenced by the estimates of domestic and foreign parametric and logistic models of bankruptcy forecasting. To assess the impact of currency risk on the Group's activities, the CorporateMetrics methodology was applied. As a financial indicator, which is influenced by currency risk, the revenue indicator of the markets in the countries where MTS Group operates: Ukraine, the Republic of Belarus and Armenia is selected. The risk factor is the exchange rate of the functional currency in the market of the country of the Group's presence to the currency fixed in the consolidated financial statements of MTS Group. The 4th quarter of 2019 was chosen as the time horizon for forecasting revenue taking into account risk, the confidence interval is set at 95%. Available historical data on quarterly revenue from the 1st quarter of 2015 were used for calculations, which amounted to 16 values for each market. Based on the hypothesis that in the medium term, the results of the organization's activities correspond to the trend and are not subject to Table 12. Historical data of the Group's quarterly revenue in the markets of Ukraine, the Republic of Belarus and Armenia for Q3 2015 – Q2 2019. | Period | Ukraine, billion hryvnia | Republic of Belarus, million Belarusian rubles |
Armenia, billion drams | | 3rd quarter 2015 | 2,6 | 117,4 | 16,9 | | 4th quarter 2015 | 2,4 | 130,2 | 18,5 | | 1st quarter 2016 | 2,6 | 144,0 | 19,3 | | 2nd quarter 2016 | 2,4 | 154,2 | 16,5 | | 3rd quarter 2016 | 2,8 | 148,9 |
14,2 | | 4th quarter 2016 | 2,7 | 161,9 | 15,0 | | 1st quarter 2017 | 2,9 | 175,0 | 15,1 | | 2nd quarter 2017 | 2,8 | 176,3 | 14,0 | | 3rd quarter 2017 | 2,8 | 169,5 | 12,9 | | 4th quarter 2017 | 2,9 |
183,8 | 14,0 | | 1st quarter 2018 | 3,0 | 198,4 | 15,4 | | 2nd quarter 2018 | 3,2 | 212,0 | 14,5 | | 3rd quarter 2018 | 2,9 | 196,4 | 13,6 | | 4th quarter 2018 | 3,1 | 212,9 | 14,3 | | 1st quarter 2019 |
3,3 | 235,9 | 15,0 | | 2nd quarter 2019 | 3,5 | 252,9 | 15,0 | The revenue forecast for each of the markets in terms of local currencies for the 4th quarter of 2019 was carried out using the Microsoft Excel program. The historical revenue values used are shown in table 12, and the forecast results are shown in table 13. Table 13. Results of the Group's revenue forecast for each market for the 4th quarter of 2019 | Period | Ukraine, million hryvnias | Republic of Belarus, million Belarusian rubles. | Armenia, million drams | | 4th quarter 2019 | 3420,59 | 251,84 | 13091,47 | Since the calculated revenue values are indicated in the local currency, in order to calculate a single revenue indicator denominated in rubles, it is required to predict the exchange rates for the 4th quarter of 2019. As these forecasts, data were taken from the Trading Economics economic portal [22], in which the predicted values represent the opinions of a group of experts. The forecast values of exchange rates are presented in table 14. Table 14. Forecast of exchange rates for the 4th quarter of 2019 | A country |
Exchange rate | Currency pair | | Ukraine | 27,4300 | USD/UAH | | Belarus | 2,1500 | USD/BYR | | Armenia | 484,5000 | USD/AMD | | Russia | 66,2895 | USD/RUB | | | | Calculated cross-course | | Ukraine | 2,4167 | UAH/RUB | | Belarus |
30,8323 | BYR/RUB | | Armenia | 0,1368 | AMD/RUB | To calculate the total revenue from the three markets for the 4th quarter of 2019, denominated in rubles, the formula (8) was used:  (8) (8)
where:  – the total amount of revenue from the three markets, denominated in rubles; – the total amount of revenue from the three markets, denominated in rubles;  , ,  , ,  – revenue of each of the presence markets, denominated in local currency; – revenue of each of the presence markets, denominated in local currency;
 , ,  , ,  – currency pairs used to convert the local currency into the ruble. – currency pairs used to convert the local currency into the ruble.
Based on revenue forecasts for each market, currency exchange rate forecasts and formula (8), the value of the expected revenue for the 4th quarter of 2019 for each of the three markets was obtained: To carry out simulation modeling of the distribution of possible revenue values, data on the exchange rates of the Ukrainian hryvnia, the Belarusian ruble and the Armenian dram from 29.06.2018 to 18.10.2019 were analyzed [23]. Table 15 shows the results of the analysis. Table 15. Characteristics of the sample of exchange rates of the Ukrainian hryvnia, Belarusian ruble and Armenian dram | Currency pair | Average value | Standard deviation | | UAH/RUB | 2,3436 | 0,1282 | | BYR/RUB |
30,8059 | 1,1020 | | AMD/RUB | 0,1315 | 0,0074 | With the help of the programming language "R" and the add-in "R-Studio", 10,000 tests were modeled according to formula (8), in which the exchange rates for the specified period were distributed according to the normal law. The simulation results are shown in Figure 4. The abscissa axis indicates the amount of revenue denominated in rubles, the ordinate axis indicates the probability expressed in fractions. The vertical line with the signature "q(a=5%)" corresponds to a 95% confidence interval, the line with the signature "Mean" corresponds to the average revenue according to the forecast, and the line "Target" indicates the revenue expected according to the previously forecast. According to the calculations: Then, the revenue, taking into account the risk, according to the formula (3): The calculated EaR value is 6.63% of the projected revenue value obtained under the following assumptions: 
Figure 4. Histogram of revenue distribution over 10,000 iterations 1. In the medium term, the financial performance of the organization does not change significantly, but follows a certain trend. Based on this assumption, a forecast of the revenue of each of the considered foreign markets of presence was made. 2. The exchange rate data for the 4th quarter of 2019 will not differ significantly from the actual ones. The currency, unlike the financial performance of organizations, has great volatility in the short term and depends on many factors. The selected currency forecasts are based on the opinions of experts whose estimates require revision. 3. At the stage of simulation, the currencies were given a normal distribution, which is a simplification of the model, since it is difficult to determine the distribution law for exchange rates over a long period of time. The three assumptions described are capable of making an error in the final result of the assessment. The existence of such an error can be explained by the difference between the predicted revenue ("Target") and the average revenue ("Mean") obtained during simulation. Based on the policy pursued by MTS PJSC, the organization can accept the identified risk or apply preventive measures, for example, using hedging instruments. The analysis of MTS PJSC's exposure to financial risks allows us to identify a number of recommendations aimed at minimizing the negative impact of financial risks on the organization's activities. According to Table 4, the risk indicators of the balance sheet liquidity of MTS PJSC assumed unsatisfactory values in 2016-2017 due to the insufficiency of highly liquid and fast-selling assets. To minimize the risk of balance sheet liquidity, it is proposed to set a limit at the level of the average industry values of the balance sheet liquidity indicators for the entire period. The limit is calculated as the maximum value of a group of A1 balance sheet items among all their values calculated for each liquidity ratio. The limit for the group of balance sheet items A1 is calculated according to the formula (9):  (9) (9)
where: – limit value;  – the function of calculating liquidity ratios; – the function of calculating liquidity ratios;
 – the average value of the liquidity ratio for the industry for the entire period. – the average value of the liquidity ratio for the industry for the entire period.
Based on the data in Table 3, the limit value will be:  The value of A1 below the calculated limit indicates the occurrence of a risk of balance sheet liquidity and requires the use of impact measures. Considering that at the end of 2018, the value of the A1 group of balance sheet items was 105,143 million rubles, then the organization has at its disposal The value of A1 below the calculated limit indicates the occurrence of a risk of balance sheet liquidity and requires the use of impact measures. Considering that at the end of 2018, the value of the A1 group of balance sheet items was 105,143 million rubles, then the organization has at its disposal  those that can be used in current activities and this will not cause difficulties in paying off current liabilities. those that can be used in current activities and this will not cause difficulties in paying off current liabilities. To reduce the amount of borrowed funds and interest on their servicing, it is recommended to use the released funds to repay the principal amount of the debt. According to the balance sheet, the amount of borrowed funds at the end of 2018 amounted to 737,383 million rubles, and interest payable amounted to 33,029 million rubles. The average percentage for servicing all borrowed funds will be  . If we direct the released absolutely liquid assets of the A1 group of articles to repay the principal amount of the debt, then the amount of liabilities will be: . If we direct the released absolutely liquid assets of the A1 group of articles to repay the principal amount of the debt, then the amount of liabilities will be:  . Then the average interest on debt service will be . Then the average interest on debt service will be  . In absolute terms, the amount of interest payable will be equal . In absolute terms, the amount of interest payable will be equal  to million rubles. In this case, the savings from the repayment of part of the debt will make up the difference between the amount of future and current interest on debt servicing: to million rubles. In this case, the savings from the repayment of part of the debt will make up the difference between the amount of future and current interest on debt servicing:  . . Calculate the economic efficiency of the proposed measures to minimize the counterparty's overall credit risk, the risk of financial insolvency and the risk of balance sheet liquidity (10):  (10) (10)
where:  – economic efficiency of the proposed measures; – economic efficiency of the proposed measures;  – the absolute value of the economic effect of risk minimization; – the absolute value of the economic effect of risk minimization;
 – the costs of minimizing risks. – the costs of minimizing risks.
The effectiveness of the proposed measures will be  . . The calculation of the effectiveness of currency risk management will be carried out separately from the calculation of the effectiveness of other types of financial risks due to different time horizons. A combination of methods of limiting and hedging currency risk is proposed as a method of influencing risk. Since the internal documents and accounting reports of MTS PJSC do not specify the costs of hedging currency risks, we will assume that they amount to 3% of the hedged amount, and we will set the limit value at 1% of the revenue forecast indicator. In this case, the economic efficiency can be calculated by the formula (11):  (11) (11)
where: – economic efficiency of the proposed measures;  – projected revenue value; – projected revenue value;
– the amount of the accepted limit; – hedging costs. The amount of the limit at the level of 1% of the projected revenue is 178.22 million. rubles'. The amount of the hedged amount is the difference between the EaR and the limit:  , and the cost of hedging: , and the cost of hedging:  . The economic efficiency will be equal . The economic efficiency will be equal  . That is, the amount of revenue at risk decreased from 6.63% to the level . That is, the amount of revenue at risk decreased from 6.63% to the level  of . of . The described system of financial risk indicators of MTS PJSC was built on the basis of available information obtained from open sources. With more complete information about the financial and economic activities of the organization, it is possible to expand and refine the list of financial risk indicators, taking into account indicators and thresholds.
References
1. Krui M. Osnovy risk-menedzhmenta / per. s angl. M. Krui, D. Galai, R. Mark – M.: Izdatel'stvo Yurait, 2019. S. 26.
2. Damodaran A. Investitsionnaya otsenka: Instrumenty i metody otsenki lyubykh aktivov / per. s angl. A. Damodaran – M.: Al'pina Biznes Buks, 2008. S. 82.
3. Mezhdunarodnyi standart ISO 31000-2018. Menedzhment riska – Rukovodstvo [Elektronnyi resurs]. – URL: https://risk-academy.ru/download/iso31000/ (data obrashcheniya: 09.10.2020).
4. Lobanov A. A., Chugunov A. V. Entsiklopediya finansovogo risk-menedzhmenta: Al'pina Biznes Buks, 2010. S. 203-205, 299-314, 323-328.
5. Khominich I. P. Upravlenie finansovymi riskami: uchebnik i praktikum dlya bakalavriata i magistratury / pod red. I. P. Khominich, I. V. Peshchanskaya. – M.: Izdatel'stvo Yurait, 2019. S. 25-30.
6. Shamsutdinova, E. R. Vliyanie finansovykh riskov na effektivnost' deyatel'nosti kompanii neftyanogo mashinostroeniya: dis. kand. ekon. nauk : 08.00.10 / Shamsutdinova Eleonora Rustemovna. – M. 2017. S.72-83.
7. «Finansovyi analiz» [Elektronnyi resurs]. – URL: http://1fin.ru/ (data obrashcheniya: 09.10.2020).
8. Khaidarshina G. A. Metody otsenki riska bankrotstva kompanii: dis. kand. ekon. nauk : 08.00.10 / Khaidarshina Gul'nara Arturovna. – M., 2009. S. 154.
9. CorporateMetrics. Technical Document [Elektronnyi resurs] // RiskMetrics Group. – URL: https://www.msci.com/documents/10199/8af520af-3e63-44b2-8aab-fd55a989e312 (data obrashcheniya: 09.10.2020).
10. Finansovye rezul'taty Gruppy MTS za chetvertyi kvartal 2017 goda i polnyi 2017 god [Elektronnyi resurs]. – URL: https://moskva.mts.ru/about/media-centr/soobshheniya-kompanii/finansovaya-otchetnost/ (data obrashcheniya: 14.10.2020).
11. Finansovye rezul'taty Gruppy MTS za chetvertyi kvartal 2018 goda i polnyi 2018 god [Elektronnyi resurs]. – URL: https://moskva.mts.ru/about/media-centr/soobshheniya-kompanii/finansovaya-otchetnost/ (data obrashcheniya: 14.10.2020).
12. Bukhgalterskaya otchetnost' za 2017 god i auditorskoe zaklyuchenie nezavisimogo auditora [Elektronnyi resurs] // Publichnoe aktsionernoe obshchestvo «Mobil'nye TeleSistemy». – URL: https://moskva.mts.ru/upload/contents/10677/bukh_balans_31122017.pdf (data obrashcheniya: 14.10.2020).
13. Bukhgalterskaya otchetnost' za 2018 god i auditorskoe zaklyuchenie nezavisimogo auditora [Elektronnyi resurs] // Publichnoe aktsionernoe obshchestvo «Mobil'nye TeleSistemy». – URL: https://moskva.mts.ru/upload/contents/10677/MTS_RAS_FS_18-r_signed.pdf (data obrashcheniya: 14.10.2020).
14. Godovaya bukhgalterskaya otchetnost' Publichnogo aktsionernogo obshchestva «Vympel-Kommunikatsii» po itogam deyatel'nosti za 2016 god [Elektronnyi resurs]. – URL: https://static.beeline.ru/upload/images/Financial%20statements_RAS_PJSC%20VC_2016.pdf (data obrashcheniya: 14.10.2020).
15. Godovaya bukhgalterskaya otchetnost' Publichnogo aktsionernogo obshchestva «Vympel-Kommunikatsii» po itogam deyatel'nosti za 2018 god [Elektronnyi resurs]. – URL: https://static.beeline.ru/upload/images/Financial-statements_RAS_PJSC-VC_2018_27_03_2019.pdf (data obrashcheniya: 14.10.2020).
16. Godovaya bukhgalterskaya otchetnost' Publichnogo aktsionernogo obshchestva «MegaFon» za 2016 god [Elektronnyi resurs]. – URL: https://corp.megafon.ru/investoram/shareholder/rsbu/ (data obrashcheniya: 14.10.2020).
17. Godovaya bukhgalterskaya otchetnost' Publichnogo aktsionernogo obshchestva «MegaFon» za 2018 god [Elektronnyi resurs]. – URL: https://corp.megafon.ru/investoram/shareholder/rsbu/ (data obrashcheniya: 14.10.2020).
18. Godovaya bukhgalterskaya otchetnost' Publichnogo aktsionernogo obshchestva mezhdugorodnoi i mezhdunarodnoi elektricheskoi svyazi «Rostelekom» za 2016 god [Elektronnyi resurs]. – URL: https://www.company.rt.ru/ir/results_and_presentations/financials/RAS/2016/4/ (data obrashcheniya: 14.10.2020).
19. Godovaya bukhgalterskaya otchetnost' Publichnogo aktsionernogo obshchestva «Rostelekom» za 2018 god [Elektronnyi resurs]. – URL: https://www.company.rt.ru/ir/results_and_presentations/financials/RAS/2018/4/ (data obrashcheniya: 14.10.2020).
20. Ofitsial'nyi sait Tsentral'nogo banka Rossiiskoi Federatsii [Elektronnyi resurs]. – URL: https://www.cbr.ru (data obrashcheniya: 18.10.2020).
21. Ofitsial'nyi sait Federal'noi sluzhby gosudarstvennoi statistiki [Elektronnyi resurs]. – URL: http://www.gks.ru (data obrashcheniya: 18.10.2020).
22. Ekonomicheskii portal «Trading Economics» [Elektronnyi resurs]. – URL: https://ru.tradingeconomics.com (data obrashcheniya: 18.10.2020).
23. Finansovyi portal «Investing.com» [Elektronnyi resurs]. – URL: https://ru.investing.com (data obrashcheniya: 18.10.2020)
|

 Eng
Eng


