|
Theoretical and Applied Economics
Reference:
Bizin, S.V., Bizina, E.V. (2026). The formation of approaches to assessing consumer demand in the Central Federal District based on leading indicators. Theoretical and Applied Economics, 2, 106–133. https://doi.org/10.25136/2409-8647.2026.2.79492
The formation of approaches to assessing consumer demand in the Central Federal District based on leading indicators
Bizin Sergei Viktorovich
ORCID: 0000-0003-3462-5327
PhD in Economics
Associate Professor; Department of Public Administration and Management; Lipetsk State Technical University
30 Moskovskaya St., Lipetsk, 398055, Russia, Lipetsk region

|
april88@yandex.ru
|
|
 |
Other publications by this author
|
|
|
Bizina Eva Viktorovna
Master's Student; Faculty of Economic Sciences; National Research University 'Higher School of Economics'
Senior Economist; Economics Department; Lipetsk Region Department of the Central Bank of the Russian Federation Main Directorate for the Central Federal District
398050, Russia, Lipetsk region, Lipetsk, Pravoberezhny district, Plekhanov Square, 4
|
|
yusina02@mail.ru
|
|
 |
|
DOI: 10.25136/2409-8647.2026.2.79492
EDN:
TOXZBO
Received:
04/20/2026
First review received: 04/24/2026 10:16 — manuscript returned for revision
Revised manuscript submitted: 04/21/2026 08:52
Final review received: 04/26/2026 08:17 — recommendation for publication.
The article is published in its final version as approved following the last positive peer review recommending acceptance for publication. It incorporates revisions made by the author in response to prior negative peer review reports that did not recommend publication. All peer review reports, including initial negative reviews, are published in open access alongside the article. All versions of the author’s revisions are archived in the publisher’s repository and may be made available upon reasonable request in accordance with Elsevier’s editorial policies and applicable data availability requirements.
Read all reviews on this article
Published:
04/28/2026
Abstract: One of the key macroeconomic indicators that determines the state of the Russian economy and ensures its growth is consumer demand. However, for the development and implementation of effective economic policies, including monetary policy, it is not enough to only monitor the dynamics of household consumption. It is important to timely identify trends and forecast consumer activity, which makes the identification of leading indicators that quickly assess consumption dynamics before the official publication of data by Rosstat especially relevant. At the same time, it should be noted that due to geographical and socio-economic peculiarities, each federal district contributes differently to overall Russian consumption. The aim of the study is to develop a system of indicators that possess leading properties and quickly evaluate the dynamics of consumer demand based on open data for subsequent use in forecasting models. The object of the study is the Central Federal District of Russia, while the subject is the indicators characterizing consumer demand in the macroregion. Traditional general scientific methods were used in the work, including deduction, systematization, and analysis, including correlation analysis. The authors examined the approaches of Russian and foreign researchers to the selection of consumer demand indicators, as well as the leading indicators used for analyzing and forecasting its dynamics. Sources of information about household consumption indicators in the Central Federal District (CFD) and in Russia as a whole, available in the public domain, were investigated and characterized considering their leading properties. As a result of the conducted study, a system of consumer demand indicators in the CFD was formed, which have a high degree of correlation with both the consumption index and with each other, and possess leading properties. The practical significance lies in the possibility of using the developed system of indicators to build forecasting models of consumer demand in macroregions, as well as in implementing monetary policy to assess the impact of the Bank of Russia's decisions on current and future trends in consumption dynamics. The results of the study contribute to economic theory by systematizing and expanding approaches to assessing consumer demand based on leading indicators.
Keywords:
consumer demand, demand factors, consumption, household expenditures, consumer activity, consumer demand indicators, leading indicators, macroeconomics, macroregion, The Central Federal District
This article is automatically translated.
You can find original text of the article here.
Disclaimer This article reflects the personal position of the authors. The content and results of this study should not be considered, including being quoted in any publications, as the official position of the Bank of Russia or an indication of the official policy or decisions of the regulator. Any errors in this material are solely copyrighted. The views expressed herein are solely those of the authors. The content and results of this research should not be considered or referred to in any publications as the Bank of Russia’s official position, official policy, or decisions. Any errors in this document are the responsibility of the authors.
Introduction Household consumer demand is an important macroeconomic indicator, since, on the one hand, it makes a significant contribution to GDP (in 2024, according to Rosstat, it amounted to about 50%) and stimulates economic growth, on the other hand, it is a key characteristic of the well-being and quality of life of the population. The dynamics and structure of household consumer activity are currently determined by three groups of factors: income, price, and non-price factors (Fig. 1). 
Figure 1 – Household consumer demand factors Source: compiled by the authors based on [1]. The impact of the determinants of consumer demand is assessed on the basis of a system of indicators (indicative). At the same time, determining the group of indicators that most accurately characterize household consumption factors is of paramount importance, both in analyzing problematic aspects and in order to predict consumer activity. Since it is not enough to study consumer demand in retrospect for the effective implementation of government policy, in particular the monetary policy of the Bank of Russia, it is necessary to identify trends in its dynamics in a timely manner and predict its values over a sufficient time horizon for decision-making. In addition, the identification and identification of indicators is especially important when assessing the impact of non-price factors of consumer activity, many of which are quite difficult to express in digital form. When choosing consumption indicators, their leading qualities should also be taken into account, since in conditions of a "lag" of statistical data due to the time lag of their official publication, leading indicators may signal future changes in household consumer activity. Using the econometric model, the "signals" of the leading indicator system can be transformed into a forecast series of consumer demand data. Thus, the choice of a system of consumer demand indicators that determine its dynamics and structure, as well as those with leading properties, is a key methodological problem in the analysis and modeling of household consumption, therefore, the study is relevant and contributes to economic theory and to the development of practical approaches to assessing consumer activity of the population. The object of the study is the Central Federal District, the subject is the consumer demand of households in the macroregion, i.e. the total expenditure of the population on food and non–food products, paid services and catering. It is worth noting that most of the indicators characterizing consumption are decomposed by territories (by federal districts and subjects of the Russian Federation), however, a number of indicators with leading properties (Savings Index, sales of passenger cars) are published nationwide, without taking into account regional specifics. The purpose of the article is to develop a system of indicators for assessing the dynamics of household consumer demand, based on open data with leading properties and taking into account the characteristics of the macroregion, for their subsequent use in the construction of econometric forecasting models. In addition, understanding the processes taking place in the field of consumer demand, identifying and digitally assessing its factors, as well as forecasting consumption will contribute to the development of a proactive approach to decision-making within the framework of the monetary policy implemented by the Bank of Russia. This article is a continuation of the author's research on consumer demand, the results of which were previously published in [1]. At this stage, it is planned to develop approaches to assessing household consumption factors based on leading indicators in the Central Federal District: to study consumer demand indicators presented in open sources; to prepare a review of domestic and foreign scientific papers regarding the authors' views on consumption indicators; to form a system of indicators and conduct a correlation analysis to determine the relationship of variables with consumer demand.
Materials and methods A study of the information field in order to search for indicators characterizing household consumption in open data has shown that consumer demand indicators can be divided into three groups from the point of view of typologizing sources: statistical economic and social; sociological and monitoring; research and rating (Fig. 2). 
Figure 2 – Information base and characteristics of indicators characterizing household consumption in Russia
Source: compiled by the authors
At the same time, scientific publications by domestic and foreign authors have not developed a unified approach to the selection and assessment of consumer demand indicators, despite a large amount of research on this topic. In the Russian scientific literature, the total monetary incomes of households, its individual components and derivatives are used as the main indicator for analyzing and forecasting consumption: wages, social benefits (including pensions) [2], minimum wage [3], monetary income per household member [5], real wages salary [5], average salary [6]. The relationship between consumer spending and household income is also reflected in the works of foreign researchers [7; 8], including the works of the founders of economic theory: D.M. Keynes, M. Friedman, F. Modigliani. Of course, changes in real incomes of the population determine the dynamics of consumer demand, its macrostructure and the transformation of the cost ratio for the purchase of individual goods within product groups. However, in our country, the data on household incomes published by Rosstat have a two-month lag, so they cannot be "leading". Foreign authors include in the system of indicators that determine household consumption: the level of prices for consumer goods [9; 10], consumer confidence indices [11], expected and unexpected changes in consumer incomes [12], indicators of credit availability and restrictions on lending [13; 14], the interest rate [15], the amount of accumulated household wealth [16]. In the work of L. Batrancea [17], which is devoted to the study of the impact of economic growth and inflation on economic sentiment and household consumption based on a sample from 28 EU countries, the following indicators were used: indicator of economic sentiment; household spending on final consumption; total unemployment; real GDP growth; wages; consumer price indices (for food; restaurants, cafes and similar establishments). Ludvigson S. C. [18] suggests making a consumption forecast based on total consumer spending and four separate groups of spending: on motor vehicles, on all goods except cars, on services and on durable goods excluding motor vehicles. In addition, the author includes data on the dynamics of labor income growth, real stock prices and the three-month treasury bill rate, as well as the consumer confidence index (all data series are presented quarterly) in the basic model. The study by D. Croushore [19] contains real household incomes, interest rates on three-month treasury bonds, and real stock prices (based on the S&P 500 index) as predictors of consumer activity. S. Dees and P. Brinca [20] supplement these variables with indicators of housing well-being and unemployment, while acting as leading indicators The consumer confidence index for European countries and real oil prices were used. According to a study of consumer demand in Chile [21], its key variables are consumer incomes, the unemployment rate, the cost of borrowed funds (the rate on consumer loans for a period of one to three months), the real and financial well-being of households (housing price index (IPV) and the general stock market price index (IGPA)), as well as the consumer confidence index. S.M. Juhro and B.N. Iyke [22], analyzing the real aggregate consumer spending of households in Indonesia, proposed using their dependence on the following indicators: dynamics of real labor incomes (average monthly net salary of an employee), real stock price indices (based on the Jakarta Composite index according to Bloomberg), short-term interest rate, indices consumer and business confidence. Many foreign researchers have used similar indicators for assessing and predicting consumption: C. D. Carroll et al. [23], J. Bram, S.C. Ludvigson [24], C.S. Fan, P.Wong [25], S.C. Ludvigson [18], A.C. Kwan, J.A. Cotsomitis [26]. However, a feature of the study by S.M. Juhro and B.N. Iyke is the use of real and nominal consumer demand of households. According to many foreign researchers, modern wealth is concentrated in stocks, so an increase in their prices leads to an increase in shareholders' expenses. In general, the growth of the stock market correlates with various categories of consumer spending [27; 28], which is why these indicators are included in demand models. Assessing the smoothing of consumer spending and the likelihood of an increase in demand for credit resources, Zh. Sh. Ishuova, M. Zh. Daribaeva and Sh. A. Boluspaev [29] used wage and employment shocks, average per capita income, education level, average age, regional size and savings volume as the main determinants, and also analyzed the demand for credit resources. The authors note that household consumption in Kazakhstan is more sensitive to changes in labor market supply (the number of employees) and is least affected by oil shocks. Some Russian authors include indicators in the system of assessing consumer demand indicators that reflect demographic processes (population size, structure of urbanization (share of urban and rural population), etc.), the level of income differentiation (uneven distribution [30], Gini coefficient [31]), as well as the cost of living and the size of the minimum wage. consumer basket [3].
Structural and dynamic changes in demand are assessed by separate industry indicators: the level of housing provision and the volume of housing construction; the level of electrification and the amount of electricity consumed by the population. The volume of sales in certain large product groups can also be used as demand indicators, for example, the dynamics of sales of electronics, household appliances, furniture, building materials, etc.[31] However, the use of these indicators in order to predict demand is complicated by difficulties both in collecting primary data and in ensuring efficiency. In E.V. Kovaleva's study [32], consumption indicators include the real interest rate, the consumer price index, the amount of debt owed by individuals on loans, as well as a number of subjective predictors: the marginal propensity to consume, consumer expectations regarding future changes in the consumer price index, monetary income, taxes, availability of goods, etc. Leonidova E.G. [33] proposed using the regression analysis method to assess the impact of individual factors on the level of final consumption of the household sector in the subject of the Russian Federation. The author attributed to the dependent indicators reflecting the factors of consumer demand in the region: annual consumer price indices by main groups (food and non-food products, as well as services); income of the population from entrepreneurial activity; average monthly nominal accrued salary; average amount of pensions awarded; primary morbidity (per 1,000 people). In the work of A.G. Skvortsova [4], from a wide range of indicators that determine consumer demand, the following variables were used to forecast final consumption expenditures: monetary income per household member; available resources of the population (funds raised and savings spent); CPI (goods and services; food products); key rate; GDP; population. When constructing a regression model of household final consumption, O.G. Tretyakova and D.S. Rozhkova [34] took into account the relationship with household incomes (in particular, wages and pensions), Internet usage, consumer price index and morbidity rate. Zemskovaya E.S. [35] examines consumer demand at the municipal level based on cluster analysis tools (the k-means method was used to describe the composition of clusters), using the following indicators: retail trade turnover and the total volume of food products sold. In Belarusian practice, the main sources of statistical information on consumption are: sample household surveys; statistics on retail turnover and paid services to the population; the Input-Output table system (areas of household use of goods and services imported and produced in the country); data from the system of national accounts on household expenditure on final consumption, broken down by purpose [36]. At the same time, for the purposes of forecasting consumer demand in the Republic of Belarus, in addition to income data (wages; real wages), we used: consumer price indices for food, non-food products and services; the real interest rate on short-term loans to individuals; the share in the total expenditure of the population on final consumption of the cost of goods and services produced for themselves and consumed in kind (mainly agricultural products of personal subsidiary farms) [37]. In the report on economic research of the Bank of Russia, R. Zakirzyanov [6], in addition to the average salary transformed into basic salary levels, considered and estimated the volume of consumer loans (excluding mortgage loans), the rate on consumer loans with a term of more than one year. At the same time, the indicator of the dynamics of the real ruble exchange rate against the US dollar was used as an exogenous variable. The information base on consumer demand is primarily Rosstat statistics, however, significant amounts of data generated in its information systems are retrospective and have a significant lag in publication time, reducing analytical value and relevance. Therefore, departmental statistics, which are generated more quickly, play an important role in analyzing and forecasting household consumption. Thus, consumer demand indicators with leading properties can include: consumer activity according to cash register equipment (KKT) according to the Federal Tax Service; the volume of incoming and outgoing payments made through the payment system of the Bank of Russia in industries focused on consumer demand (according to the Bank of Russia); morbidity population based on information from the Ministry of Health of the Russian Federation and Rospotrebnadzor (including subordinate organizations, for example, regional Medical information and analytical centers); migration processes (the Ministry of Internal Affairs of Russia); data from Agencies promoting the development of trade activities. At the same time, the main disadvantages of departmental statistics are the difficulty of obtaining them and the quality of the data: incompatibility (for example, weekly values), the presence of "noise", the frequency and frequency of publication of data, etc. In addition to the socio-economic indicators of Rosstat and departmental statistics, the leading indicators of consumption are data based on surveys of the population and businesses on expectations for key economic aspects of activity (prices, costs, incomes, etc.). However, the disadvantage of this information is its subjectivity, especially when interviewing different social groups of the population and enterprises from a wide range of industries participating in the sample. It is worth noting that some foreign researchers question the use of indicators (indices) of consumer sentiment (confidence, etc.) in forecasting consumption [38; 39]. In general, the practice of analyzing and forecasting consumer demand provides a wide range of indicators that characterize the expectations of the population and the business community. Thus, Rosstat calculates a generalized (composite) consumer confidence index, determined on the basis of indices of past and expected changes in both personal financial situation and the economic situation in Russia. It is worth noting that the dynamics of consumer demand of the population generally coincides with the assessment of the index [40]. Sugaipov, D. R. [41] used quarterly data on household spending on final consumption and the consumer confidence index as a leading indicator of consumption when making consumption forecasts.
To study the dynamics of consumption, the Ivanov consumer index is used, developed in 2013 by the analytical department of Sberbank CIB, which is calculated based on surveys of the population (several thousand people) of various ages living in more than a hundred Russian cities. Important elements of the index are spending, savings, and the level of confidence of middle-income consumers, as well as wage expectations. The positive side of this index is its ability to track consumer reactions to changes in the prices of basic goods of a wide group, both during crisis and relatively prosperous economic cycles. At the same time, the index does not have leading properties, since it is published quarterly with a time lag of more than a month, and some researchers [42] believe that it more characterizes consumer sentiment mainly in the "lower" middle class The expediency of using consumer and economic sentiment indicators as leading indicators for analysis and modeling has been confirmed by numerous studies using the example of various countries. Al-Eyd et al. [43] found that there is a short-term predictive relationship between consumer confidence and actual consumption in a number of large industrialized countries (Germany, Italy, France, the United Kingdom, and the United States). In foreign sources, the consumer confidence index is used as a sociological, leading indicator: according to the United States, based on the Michigan Index and the index from the Conference Board [23; 18]; a special index according to European countries [20]. At the same time, Gausden & Hasan [44] used seven different sentiment indicators in consumption forecasting models in comparison with the main indicator of consumer confidence in the EU using the example of quarterly data from the EU (France, Germany, Italy and the Netherlands) and the United Kingdom. The authors proved that none of the sentiment indicators has significant advantages, while noting the impact of such indices on the forecasted dynamics of household consumption and the importance of taking them into account in models. However, Acuña et al. [21] argue that high consumer confidence is most associated with positive changes in future spending: due to low financial literacy, consumers in Chile tend to have behavioral biases, so household spending will change asymmetrically in response to similar changes in consumer optimism or pessimism. For a comprehensive assessment of consumption processes, their analysis and forecasting in the future, along with indicators of consumer confidence, the business confidence index is also used [22]. In this regard, it is worth emphasizing that, along with many foreign central banks, the Bank of Russia has been monitoring (polling) non-financial sector enterprises on a monthly basis since 1999, the data of which promptly signals the situation in the country's economy (macro-regions, regions) [45] and can serve as leading indicators in forecasting consumer demand. The survey data is of the greatest interest in terms of the current assessment of demand and its changes in retailers, consumer goods companies, as well as hotels and catering establishments. In addition, data on the dynamics of the Bank of Russia's Business climate Indicator (BIC) for this group of enterprises can be used. Of particular interest is the work of Song & Shin [46] based on data from South Korea, in which the leading indicator is the index of news sources. News content is analyzed based on keywords, with the definition of their semantic tonalities (consumers' attitude to the current economic situation and their expectations), on the basis of which monthly time series are built. So, the authors used economic indicators that evaluate consumption: indices of durable and short-term goods, the retail sales index (the left side of the control); the level of employment and unemployment (the right side of the equation). It is worth noting that the Bank of Russia's system of indicators has a similar leading indicator in terms of properties and qualities – the "Retail Press Tone Index", which is measured in points with effect boundaries (positive or negative) [47]. From the perspective of leading properties, consumer activity indices of payment systems (Sberbank – Sberindex; T-Bank – Tinkoff CoronaIndex) [48] and information on the sale of new cars, published fairly promptly by the analytical agency in the field of statistics and analytics of the automotive business "AUTOSTAT", can also be used in the analysis and forecasting of consumer demand. At the same time, the disadvantages of the above indicators are the harmonization of data as statistics are published by Rosstat and the all-Russian nature of the indicators, which excludes the possibility of studying household consumption in individual subjects of the Russian Federation and macroregions. In addition, there is a risk that data publication will cease (for example, T-Bank). Separately, among the sources of leading indicators of consumer demand it is possible to allocate information about search queries (Google Trends, "Yandex.Wordstat") [49]. Thus, Hyunyoung Choi and Hal Varian [50] established a link between the dynamics of special search queries (Google Trends) and the volume of sales of housing, cars, tourist flow, as well as the unemployment rate [48]. In Russian practice, E. Golovanova and A. Zubarev [49] studied the relationship and impact of Google Trends search queries for various product groups. Indicators of the physical volume of retail trade in food and non-food products and Google Trends data were used as target variables. The predictive model also included: the level of consumer confidence developed by the All-Russian Center for the Study of Public Opinion (VTsIOM), which shows the favorable time for making large purchases; the Russian volatility index, which characterizes changes in consumption due to fluctuations in the stock market; the real effective exchange rate of the ruble; the price of Brent crude oil. The stable relationship between search query statistics and real economic indicators allows us to consider the possibility of using these data to predict consumer demand.
Thus, household consumption is influenced by a group of factors, each of which is decomposed into a system of indicators (indicative), contributing to the dynamics and structure. Studies by foreign and domestic authors allow us to conclude that the key indicators of consumer activity for analysis and forecasting purposes are indicators of household income, expectations and confidence of the population and business, interest rates on the money market, consumer price index for goods and services, as well as the unemployment rate and stock price indices. To account for the Russian specifics of the economy, individual researchers included the real effective exchange rate of the ruble and the price of Brent crude oil in the system of consumer demand indicators. It is worth noting that most indicators characterizing consumer demand are retrospective and are published by Rosstat, therefore, leading indicators are important for an up-to-date assessment and forecasting of its dynamics.
Results and discussion The effectiveness of forecasting household consumption dynamics depends both on the choice of appropriate methods and models, and on the factors of consumer demand expressed by the indicator system. As an indicator of consumer demand (a dependent variable), the author suggests using data on seasonally adjusted monthly consumption growth rates (as a percentage of the previous month) - the consumption index. It is calculated as a composite index that includes indices for the previous month in comparable prices of retail trade turnover, the volume of paid services to the public and the turnover of public catering, where the weights are the nominal values of the indicators in the base period. The dynamics of the consumption index in the Central Federal District compared to the previous month (mom sa) and to the base period (December 2017 assumed to be 100%) is shown in Figures 3 and 4. 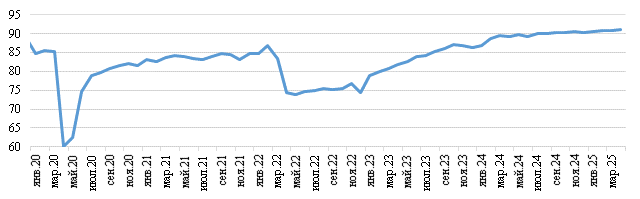
Figure 3 – Actual consumption data in the Central Federal District, mom sa dec.2017=100 increase % Source: compiled by the authors
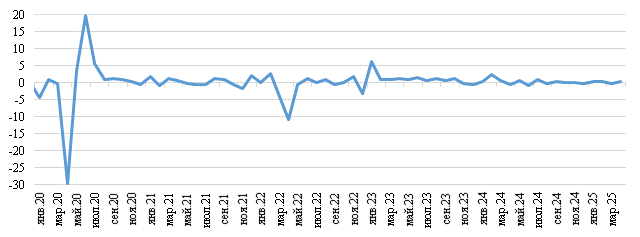
Figure 4 – Actual consumption data in the Central Federal District, mom sa growth % Source: compiled by the authors
The seasonal smoothing of the consumption index in the Central Federal District was carried out by series in the jDemetra+ software. In the period under study, two "shocks" in the dynamics of consumer demand in Central Russia can be distinguished, caused by external factors: in April 2020, which was associated with the COVID-19 pandemic; in April 2022, due to unprecedented sanctions pressure on the Russian economy. Subsequently, in the context of rising household incomes, consumer demand in the Central Federal District as a whole had a positive trend, but did not reach the level of December 2017 in comparable prices. Based on a review of scientific papers by domestic and foreign researchers and based on economic logic, the author selected indicators officially published by Rosstat, departmental statistics, a news index and survey indicators, including those based on the results of monitoring of non-financial sector enterprises of the Bank of Russia (Table. 1). Table 1 – The system of consumer demand indicators in the Central Federal District
| Name | Information base | Type of indicator | Period | Designation | | Consumption, mom sa % | Rosstat | Statistical |
Jan.2018- Apr.2025 | rst_potrebl_momsa | | Leading predictors | | Consumer activity according to the Federal Tax Service (CCT, monthly average), p. | Federal Tax Service, official website | Departmental | Feb.2022- May.2025 | fns_potractivn_CFO_sa_p | | The growth rate of incoming payments made through the Bank of Russia's payment system in consumer-oriented industries, mom def. sa % | Bank of Russia | Departmental | Jan.2018- Apr.2025 | plt_inpnobg_momsa | | The growth rate of outgoing payments made through the Bank of Russia's payment system in consumer-oriented industries, mom def. sa % | Bank of Russia | Departmental | Jan.2018- Apr.2025 | plt_outnobg_momsa | | Index of real consumer spending on consumption (Savings Index for Russia, monthly), mom sa growth % | SBER, the official website | Research | Jan.2019- Apr.2025 |
sb_emsrrash_potrbl_momsa | | Index of real consumer spending on non-food products (Savings Index for Russia, monthly), mom sa growth % | SBER, the official website | Research | Jan.2019- Apr.2025 | sb_emsrrash_neprd_momsa | | Index of real consumer spending on food products (Savings Index for Russia, monthly), mom sa growth % | SBER, the official website | Research | Jan.2019- Apr.2025 | sb_emsrrash_prod_momsa | | Index of real consumer spending on services (Savings Index for Russia, monthly), mom sa growth % | SBER, the official website | Research | Jan.2019- Apr.2025 | sb_emsrrash_uslg_momsa | | Income factors | | Real wages, mom sa % | Rosstat | Statistical | Jan.2018- Mar.2025 | rst_rzp_momsa | | The percentage of respondents expecting an improvement in their financial situation during the year (inFOM), % |
The Infom survey | Sociological (monitoring) | January 2018- June 2025 | ifom_dolulmatpl_prc | | Volume of consumer loans disbursements, mom sa % | Bank of Russia | Departmental | Jan.2018- Apr.2025 | cbr_obmvyd_ptrkrd_momsa | | Volume of car loans issued, mom sa % | Bank of Russia | Departmental | Jan.2018- Apr.2025 | ATGM Aircrew_momsa | | Dynamics of consumer credit issuance, mom sa growth % | Bank of Russia | Departmental | Jan.2018- Apr.2025 | issues_Consumerkredit_mosa | | The share of consumer loans in consumer demand (the sum of retail sales and paid services), % | Bank of Russia | Departmental | Jan.2018- Apr.2025 | Share the credit in the inquiry |
| Price factors | | Inflation expectations of the population, p.
| The Infom survey | Sociological (monitoring) | January 2018- June 2025 | ifom_inflozid_prc | | Non-price factors, including | | Psychological and behavioral factors | | Index of large purchases (inFOM), p. | The Infom survey | Sociological (monitoring) | January 2018- June 2025 | ifom_indkrupn_pok_p | | The supply factor and the level of competition in the markets of goods and services | | The index of the tone of the press about retail in the Russian Federation, p. | Calculations by the Central Federal District of the Bank of Russia based on news parsing | Research | January 2018- June 2025 | eu_indtonaln_p | | Expectations of changes in demand by enterprises of OKVED2 "Consumer goods production", balance of responses sa p. | Enterprise monitoring Bank of Russia | Sociological (monitoring) |
January 2018- June 2025 | mp_ozidspr_vyppt_sa_p | | Expectations of demand changes by enterprises of the OKVED2 "Retail trade, except for trade in motor vehicles and motorcycles", balance of responses sa p. | Enterprise monitoring Bank of Russia | Sociological (monitoring) | January 2018- June 2025 | mp_ozidspr_rozntorgnoauto_sa_p | | Expectations of demand changes by enterprises of OKVED2 "Retail trade in passenger cars", the balance of responses sa p. | Enterprise monitoring Bank of Russia | Sociological (monitoring) | January 2018- June 2025 | mp_ozidspr_torgavto_sa_p | | Expectations of demand changes by OKVED2 enterprises "Activities of hotels and public catering enterprises", balance of responses sa p. | Enterprise monitoring Bank of Russia | Sociological (monitoring) | January 2018- June 2025 | mp_ozidspr_horeca_sa_p | Source: developed and compiled by the authors
The author used monthly data in the form of indexes (% growth rate compared to the previous month) with the exception of the seasonal factor, except for the indicators: "The share of respondents expecting an improvement in their financial situation during the year (inFOM), %", "Index of large purchases (inFOM), p." and "Index of the tone of the retail press, p."). The time coverage of the actual values of the indicators mainly comprised the period from January 2018 to April-June 2025. At the same time, statistical data on individual indicators are available only from a later period: "Index of real consumer spending on consumption (Savings Rate for the Russian Federation, monthly)" from January 2019; "Consumer activity according to the Federal Tax Service" from February 2022.
It is worth noting that the preliminary selection of indicators was carried out based on economic logic, but in order to determine and quantify the relationship of the selected indicators with the consumption index, the author checked the variables using correlation analysis, including checking the change in the pairwise correlation coefficient, taking into account lags. The correlation analysis of the database of household consumption indicators in the Central Federal District was implemented using MS Excel calculation automation tools (VBA analysis package, Data Analysis module, Correlation analysis tool). The results of the correlation analysis of the consumption index and consumer demand indicators in Central Russia (dependent and explanatory variables), both taking into account and without taking into account time lags (for 1 and 2 periods), are shown in Fig. 5-7.
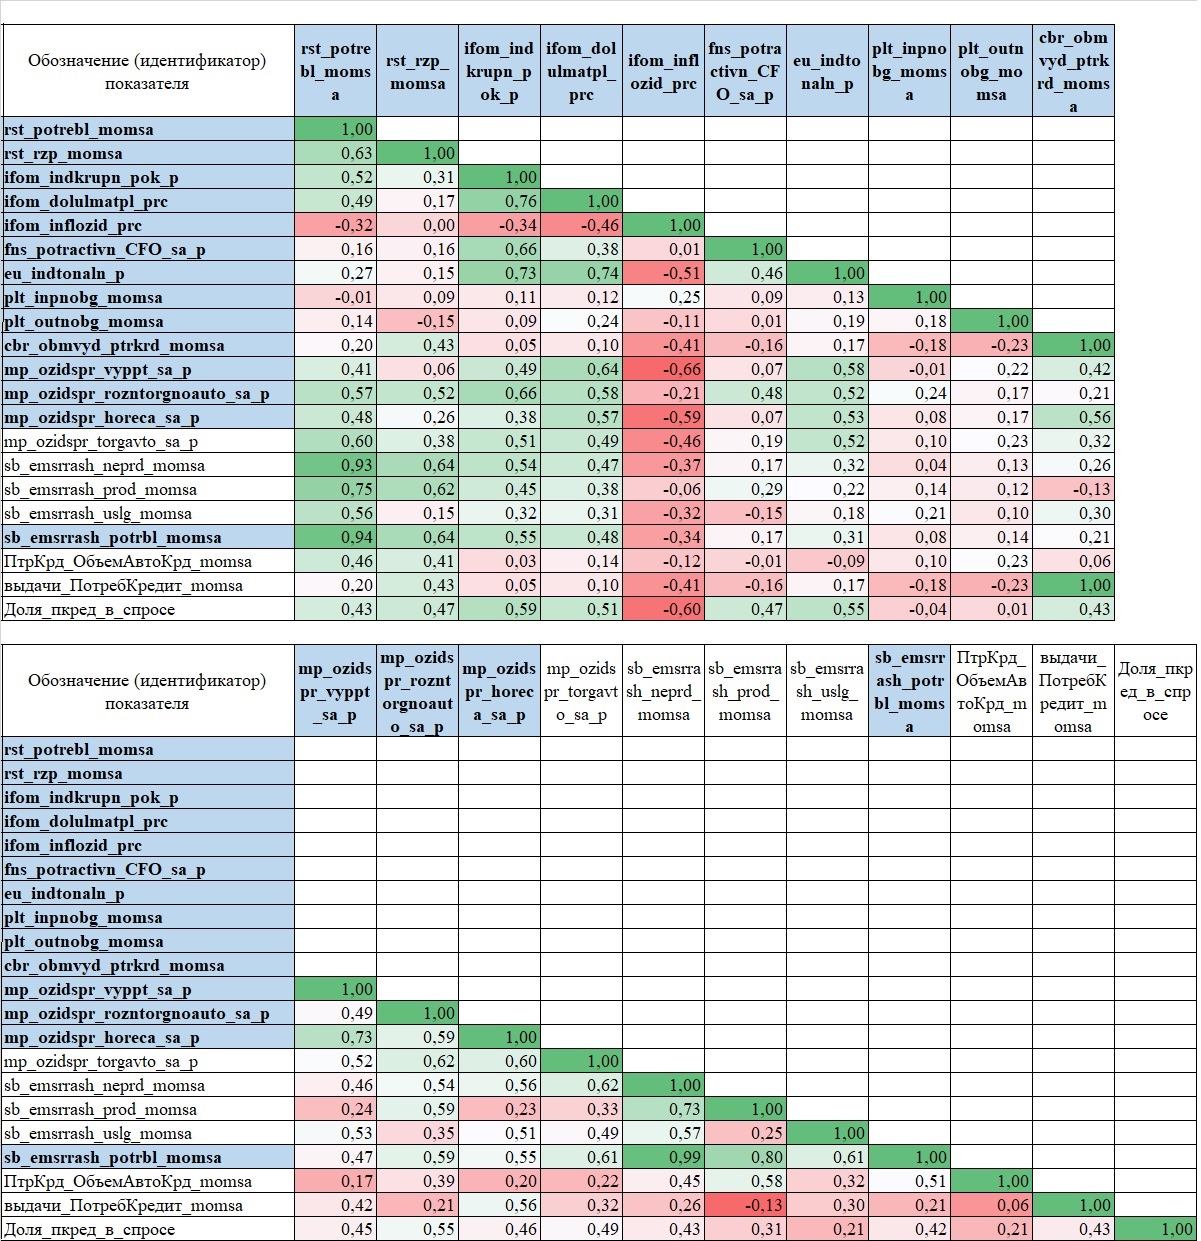
Figure 5 – Coefficients of paired correlation of indicators without taking into account lags Source: compiled by the authors
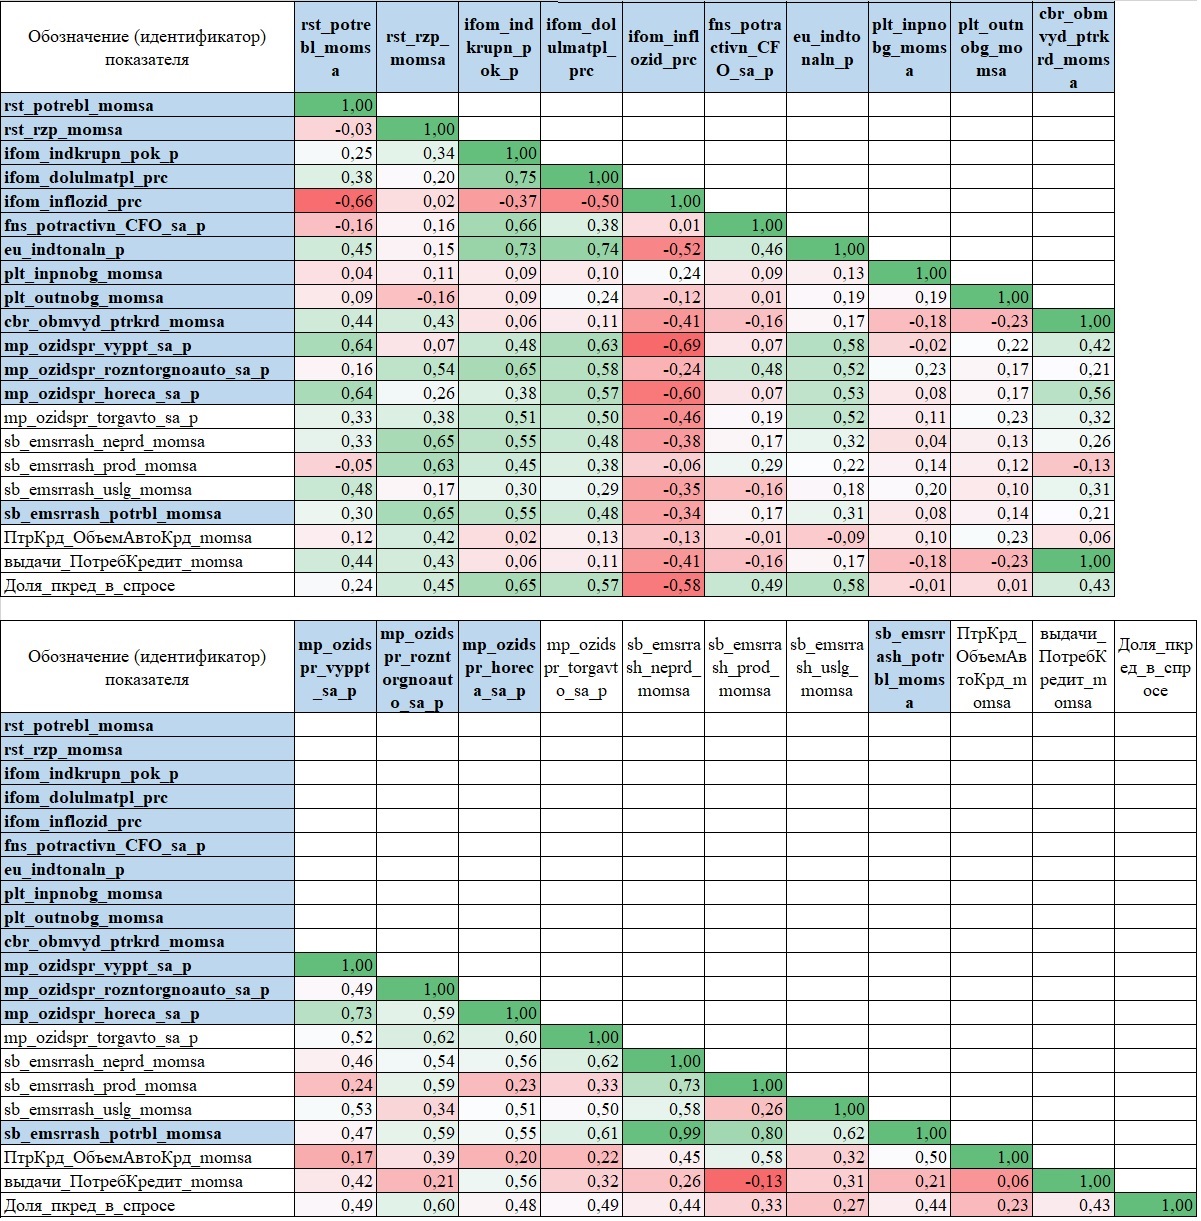
Figure 6 – Coefficients of paired correlation, dependent and explanatory variables with a lag of 1 Source: compiled by the authors 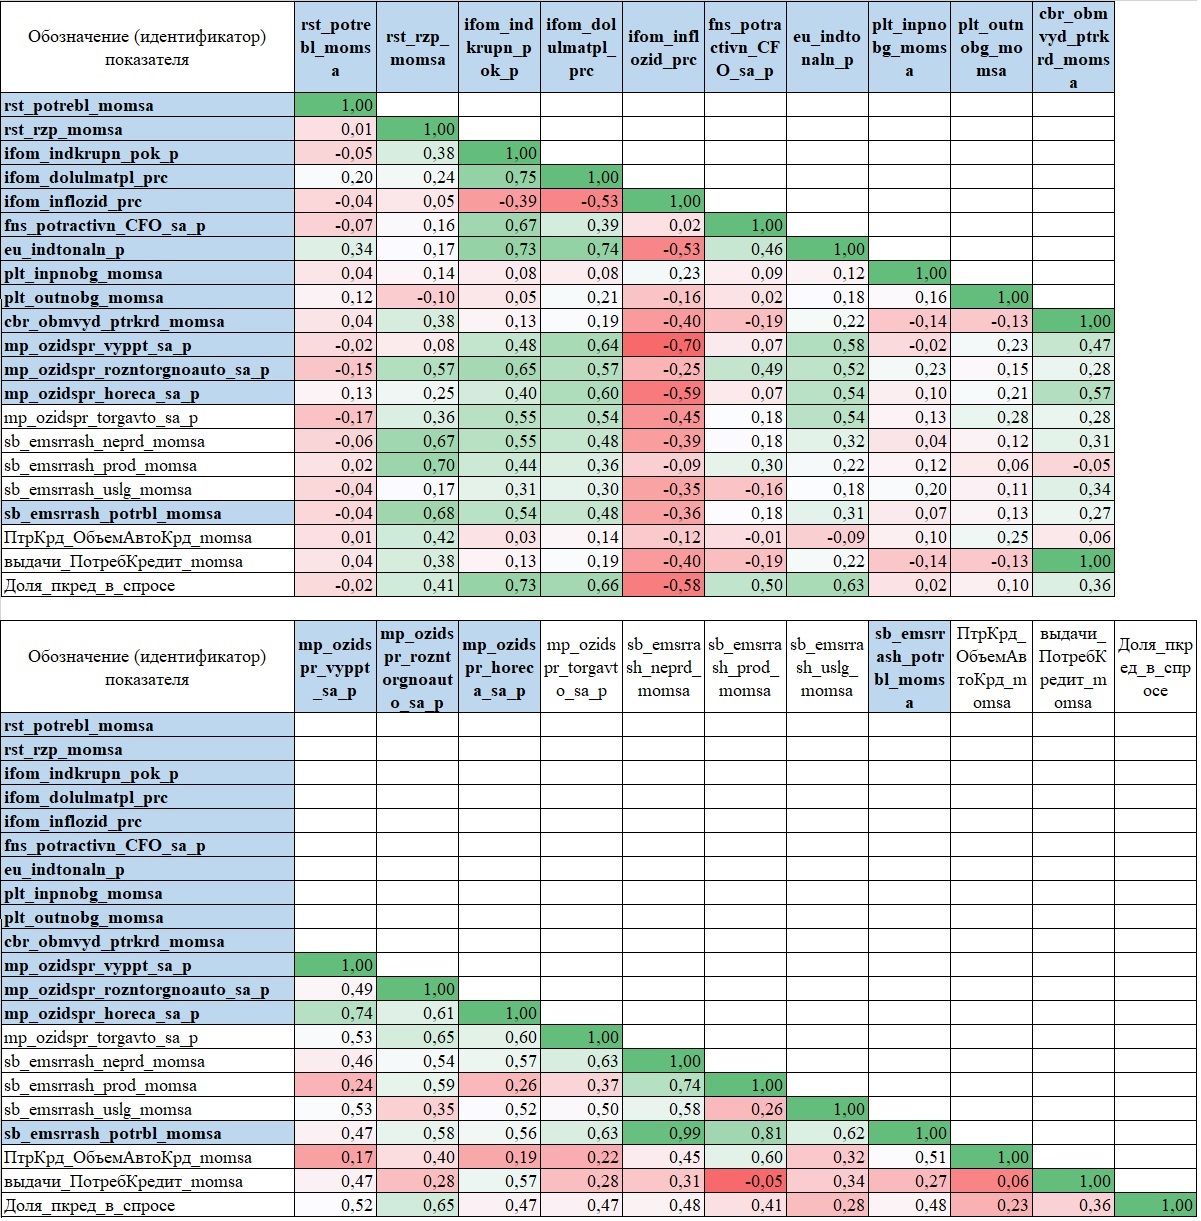
Figure 7 – Coefficients of paired correlation, dependent and explanatory variables with a lag of 2 Source: compiled by the authors
Based on the results of the paired correlation test, 8 indicators (explanatory variables) of consumer demand in the Central Federal District showed a lower direct dependence on the consumption index, as well as a relationship with other indicators of consumer activity (Table 2). Therefore, their further use for forecasting purposes is impractical.
Table 2 – List of consumption indicators in the Central Federal District that were not selected based on the correlation analysis method | Designation (identifier) | Naming of the indicator | | mp_ozidspr_torgavto_sa_p | Expectations of demand changes by enterprises of OKVED2 "Retail trade in passenger cars", the balance of responses sa p. | | sb_emsrrash_neprd_momsa | Index of real consumer spending on non-food products, Russian Savings Bank (monthly), mom sa growth %; | | sb_emsrrash_prod_momsa | Index of real consumer spending on food products, Russian Savings Bank (monthly), mom sa growth %; | | sb_emsrrash_uslg_momsa | Index of real consumer spending on services, Russian Savings Bank (monthly), mom sa growth % | | ATGM Aircrew_momsa |
Volume of car loans issued, mom sa % | | issues_Consumerkredit_mosa | Dynamics of consumer credit issuance in the Central Federal District, mom sa growth % | | Share the credit in the inquiry | The share of consumer loans in consumer demand (the sum of retail sales and paid services), % | Source: compiled by the authors
As a result, out of 20 macroeconomic indicators characterizing consumer demand in the Central Federal District, 13 were selected with the highest degree of correlation with the consumption indicator and "codependency" with other explanatory variables (Fig. 8). 
Figure 8 – The system of consumer demand indicators in the Central Federal District Source: compiled by the authors
In general, from the point of view of the classification of household consumption factors (Fig. 1), the system of consumer demand indicators in the Central Federal District provides its digital assessment in the context of each of the groups (income factors, price and non-price factors). In addition, these indicators have a high degree of correlation with both the consumption index and each other, also having leading qualities. This allows us to recommend the use of the system of household consumption indicators proposed by the author in the Central Federal District for the purposes of analysis and short-term forecasting of the consumer demand index in the macroregion.
Conclusion An urgent problem in analyzing and forecasting household consumption in a macroregion is the choice of indicators and indicators that characterize its dynamics, while having leading properties. In addition, there is currently no single source of statistical information that would contain long-term dynamic series comparable in time and territory (country, macroregion, region), while data for past periods have been clarified and revised, and the methodology for calculating indicators has changed. Based on the results of the study, based on the study of theoretical and practical works on the subject under study, as well as taking into account the evaluation of statistical information on indicators, the author proposed a system of indicators (including advanced ones) that best characterize household consumption in the Central Federal District and meet analytical criteria (long-term dynamic series; unchanged calculation methodology, etc.). The source of information for assessing consumer demand in Central Russia was official data published by Rosstat, departmental statistics, a news index and survey indicators, including data from monitoring enterprises regularly conducted by the Bank of Russia. The correlation analysis of data from 2018 in the Central Federal District made it possible to assess the relationship of indicators with the seasonally adjusted consumption index in monthly dynamics, including taking into account time lags. As a result, 13 explanatory variables of consumer demand in the macroregion were selected from 20 indicators. Further research will be related to the development of a model for short-term forecasting of consumer demand in the Central Federal District based on a developed system of indicators and leading indicators.
The article is published in its final version as approved following the last positive peer review recommending acceptance for publication. It incorporates revisions made by the author in response to prior negative peer review reports that did not recommend publication. All peer review reports, including initial negative reviews, are published in open access alongside the article. All versions of the author’s revisions are archived in the publisher’s repository and may be made available upon reasonable request in accordance with Elsevier’s editorial policies and applicable data availability requirements.
Read all reviews on this article
References
1. Bizin, S.V. (2025). On the issue of consumer demand factors. Theoretical and Applied Economics, 2, 71-95. https://doi.org/10.25136/2409-8647.2025.2.74229
2. Leonidova, E.G. (2025). Reserves for Stimulating Final Consumption of the Population in the Regions of Northwest Russia. Manager, 16(1), 61-75. https://doi.org/10.29141/2218-5003-2025-16-1-5
3. Snimshikova, I.V. (2023). Factors of Distortion of Consumer Demand of the Population of Russia under Sanction Restrictions. Humanities, Socio-Economic and Social Sciences, 6, 270-276. https://doi.org/10.23672/SAE.2023.98.78.044
4. Skvortsova, A.G. (2023). Analysis of the Dynamics of Consumer Demand in Russia. Bulletin of the Moscow Financial-Legal University, 4, 247-256. https://doi.org/10.52210/2224669X_2023_4_247
5. Rozhkowskaya, E.A. (2008). Econometric Model of Analysis and Forecasting of Elements of Final Consumption of the Republic of Belarus: Conceptual and Methodological Approaches, Results of Calculations. Applied Econometrics, 4(12), 27-41.
6. Zakirzyanov, R. (2021). Assessment of the Factors of Regional Differentiation of Consumer Demand in the Russian Federation. Series of Reports on Economic Research, 68. http://cbr.ru/Content/Document/File/170356/analytic_note_20241210_ddkp.pdf
7. Whalen, C.J. (2012). Post-Keynesian Institutionalism after the Great Recession. Levy Economics Institute of Bard College, Working Paper, 724. http://dx.doi.org/10.2139/ssrn.2062469
8. Ball, L.M., & Mankiw, N.G. (2021). Market Power in Neoclassical Growth Models. National Bureau of Economic Research, w28538, 1-35. https://ssrn.com/abstract=3799829
9. Deaton, A., & Muellbauer, J. (1980). An Almost Ideal Demand System. American Economic Review, 70(3), 312-326.
10. Brave, S.A., & Bruun, K. (2022). Measuring the Impact of Inflation on U.S. Consumer Spending. Morning Consult Economic Analysis. https://pro-assets.morningconsult.com/wp-uploads/2024/03/221024_October-Econ-White-Paper-3.pdf
11. Jappelli, T., & Pistaferri, L. (2010). The Consumption Response to Income Changes. NBER Working Paper, 15739, 59.
12. Bunn, P., Le Roux, J., Reinold, K., & Surico, P. (2017). The Consumption Response to Positive and Negative Income Changes. Bank of England Working Paper, 645, 48.
13. Wakabayashi, M., & Horioka, C.Y. (2005). Borrowing Constraints and Consumption Behavior in Japan. NBER Working Paper, 11560, 43.
14. Hundtofte, S., Olafsson, A., & Pagel, M. (2019). Credit Smoothing. NBER Working Paper, 26354, 71.
15. Fernandez-Corugedo, E. (2004). Consumption Theory. Bank of England Handbook in Central Banking, 23, 48.
16. Breza, E., & Kinnan, C. (2018). Measuring the Equilibrium Impacts of Credit: Evidence from the Indian Microfinance Crisis. NBER Working Paper, 24329, 82.
17. Batrancea, L. (2021). Empirical Evidence Regarding the Impact of Economic Growth and Inflation on Economic Sentiment and Household Consumption. Journal of Risk and Financial Management, 14, 336. https://doi.org/10.3390/jrfm14070336
18. Ludvigson, S.C. (2004). Consumer Confidence and Consumer Spending. Journal of Economic Perspectives, 18(2), 29-50. https://doi.org/10.1257/0895330041371222
19. Croushore, D. (2005). Do Consumer-Confidence Indexes Help Forecast Consumer Spending in Real Time? The North American Journal of Economics and Finance, 16(3), 435-450. https://doi.org/10.1016/j.najef.2005.05.002
20. Dees, S., & Brinca, P.S. (2013). Consumer Confidence as a Predictor of Consumption Spending: Evidence for the United States and the Euro Area. International Economics, 134, 1-14. https://doi.org/10.1016/j.inteco.2013.05.001
21. Acuña, G., Echeverría, C., & Pinto-Gutiérrez, C. (2020). Consumer Confidence and Consumption: Empirical Evidence from Chile. International Review of Applied Economics, 34(1), 75-93. https://doi.org/10.1080/02692171.2019.1645816
22. Juhro, S.M., & Iyke, B.N. (2020). Consumer Confidence and Consumption Expenditure in Indonesia. Economic Modelling, 89, 367-377. https://doi.org/10.1016/j.econmod.2019.11.001
23. Carroll, C.D., Fuhrer, J.C., & Wilcox, D.W. (1994). Does Consumer Sentiment Forecast Household Spending? If So, Why? The American Economic Review, 84(5), 1397–1408.
24. Bram, J., & Ludvigson, S.C. (1998). Does Consumer Confidence Forecast Household Expenditure? A Sentiment Index Horse Race. Economic Policy Review, 4(2), 59-78.
25. Fan, C.S., & Wong, P. (1998). Does Consumer Sentiment Forecast Household Spending? The Hong Kong Case. Economics Letters, 58(1), 77-84.
26. Kwan, A.C., & Cotsomitis, J.A. (2006). The Usefulness of Consumer Confidence in Forecasting Household Spending in Canada: A National and Regional Analysis. Economic Inquiry, 44(1), 185-197.
27. Poterba, J.M. (2000). Stock Market Wealth and Consumption. Journal of Economic Perspectives, 14(2), 99-118.
28. Swamy, V. (2020). Financial Wealth Effects and Consumption Expenditure. International Journal of Finance & Economics.
29. Ishuova, Z.Sh., Daribayeva, M.Zh., & Boluspaev, Sh.A. (2023). Assessment of Smoothing of Consumer Expenditures of Kazakhs and Their Chances for Increasing Demand for Credit Resources. Bulletin of Eurasian Science, 15(4), 84-96. https://doi.org/10.15862/50ECVN423
30. Volkova, N.A., & Katanaev, N.T. (2022). Analysis of the Social Factor Affecting Consumer Demand. Management Accounting, 4-3, 503-509. https://doi.org/10.25806/uu4-32022503-509
31. Myrzalieva, M.A. (2021). Formation of Consumer Behavior in the Market of Goods and Services. Science, New Technologies and Innovations of Kyrgyzstan, 4, 233-238.
32. Kovaleva, E.V., & Tsymbalyuk, M.V. (2023). Factors of Consumer Demand Determining Economic Growth of the Russian Economy. Bulletin of the Siberian State Industrial University, 2(44), 103-110. https://doi.org/10.57070/2304-4497-2023-2(44)-103-110
33. Leonidova, E.G. (2020). Factors of Final Consumption of Households in the Region. Issues of Territorial Development, 8(5), 5. https://doi.org/10.15838/tdi.2020.5.55.5
34. Tretyakova, O.G., & Rozhkova, D.S. (2017). Analysis of Factors Affecting the Level of Final Consumption of Households in the Russian Federation. Financial Analytics: Problems and Solutions, 10(5), 518-533. https://doi.org/10.24891/fa.10.5.518
35. Zemskova, E.S., & Koloskov, D.A. (2017). Deformation of the Structure of Final Consumption as an Obstacle to Economic Growth (on the Example of the Republic of Mordovia). Internet Journal of Science Studies, 9(6), 69.
36. Rozhkowskaya, E.A. (2019). Trends in Changing the Structure of Consumer Expenditures of the Population of Belarus and Foreign Countries. Economic Bulletin of the Scientific Research Economic Institute of the Ministry of Economy of the Republic of Belarus, 5(263), 4-16.
37. Rozhkowskaya, E.A. (2009). Main Factors and Sources of Growth of Final Consumption of Households. Economics, Modeling, Forecasting, 3, 113-131.
38. Fuhrer, J.C. (1993). What Role Does Consumer Sentiment Play in the US Macroeconomy? New England Economic Review, (Jan), 32-44.
39. Croushore, D. (2005). Do Consumer-Confidence Indexes Help Forecast Consumer Spending in Real Time? The North American Journal of Economics and Finance, 16(3), 435-450. https://doi.org/10.1016/j.najef.2005.05.002
40. Demchenko, S.K., Schmitt, M.A., & Demchenko, O.S. (2021). The Impact of Consumer Demand on the Dynamics of the National Economy. Trade, Service, Food Industry, 1(1), 12-19. https://doi.org/10.17516/2782-2214-0002
41. Sugayipov, D.R. (2022). Forecasting Consumption Based on the Consumer Confidence Index in Russia. Bulletin of Moscow University. Series 6: Economics, 2, 45-70. https://doi.org/10.38050/01300105202223
42. Iosipenko, V.D. (2020). Factors Forming Stable Demand for Food. Regional Agro-Systems: Economics and Sociology, 2, 55-61.
43. Al-Eyd, A.J., Barrell, R., & Davis, E.P. (2009). Consumer Confidence Indices and Short-Term Forecasting of Consumption. The Manchester School, 77(1), 96-111. https://doi.org/10.1111/j.1467-9957.2008.02089.x
44. Gausden, R., & Hasan, M.S. (2020). Comparative Performances of Measures of Consumer and Economic Sentiment in Forecasting Consumption: A Multi-Country Analysis. Applied Economics, 52(10), 1088-1104. https://doi.org/10.1080/00036846.2019.1659489
45. Koroleva, G.A., & Svistunova, M.Yu. (2018). Monitoring of Non-Financial Sector Enterprises by the Bank of Russia as an Important Tool for Stabilization and Development of the Economy. Bulletin of Voronezh State University. Series: Economics and Management, 2, 152-158.
46. Song, M., & Shin, K.S. (2019). Forecasting Economic Indicators Using a Consumer Sentiment Index: Survey-Based Versus Text-Based Data. Journal of Forecasting, 38(6), 504-518. https://doi.org/10.1002/for.2584
47. Kladova, A.A. (2025). The Sentiment of News as an Operational Indicator of Consumer Sentiments. Bulletin of the University of the Moscow Government, 1, 32-37.
48. Kachalov, G.V. (2021). External Data in Forecasting Enterprise Activities. Strategic Planning and Development of Enterprises: Materials of the XXII All-Russian Symposium. Moscow, April 13–14, 2021. Central Economic and Mathematical Institute of the Russian Academy of Sciences, 468-471. https://doi.org/10.34706/978-5-8211-0796-1-s5-05
49. Golovanova, E., & Zubarev, A. (2021). Forecasting Aggregate Retail Sales with Google Trends. Russian Journal of Money and Finance, Bank of Russia, 80(4), 50-73. https://doi.org/10.31477/rjmf.202104.50
50. Choi, H., & Varian, H.R. (2009). Predicting the Present with Google Trends. The Economic Record, 88(s1), 2-9. https://doi.org/10.2139/ssrn.1659302
First Peer Review
Peer reviewers' evaluations remain confidential and are not disclosed to the public. Only external reviews, authorized for publication by the article's author(s), are made public. Typically, these final reviews are conducted after the manuscript's revision. Adhering to our double-blind review policy, the reviewer's identity is kept confidential.
The list of publisher reviewers can be found here.
An article on the topic "Formation of approaches to assessing consumer demand in the Central Federal District based on leading indicators" is submitted for review for publication in the journal Theoretical and Applied Economics. The subject of the study is the consumer demand of households in the Central Federal District and a system of leading indicators to assess its dynamics. The author sets the task of forming a set of indicators with predictive power for subsequent use in econometric modeling. The methodological basis of the work includes a review of domestic and foreign literature, the collection and systematization of empirical data (Rosstat, the Bank of Russia, the Federal Tax Service, surveys "inFOM", Sberindex, etc.), correlation analysis with the calculation of paired coefficients, as well as the procedure of seasonal smoothing (jDemetra+). This approach allows us to achieve the stated goal only at a preliminary level, since it does not go beyond descriptive statistics and does not include the construction of an econometric model, checking the stationarity of series, or Granger causality testing. The choice of indicators remains largely "manual" and is not supported by formal criteria other than economic logic and data availability. This reduces the rigor of the methodology and leaves open the question of the actual outperformance of the selected variables. The relevance of the topic is beyond doubt. In conditions of high economic volatility and lags in official statistics, the development of operational (leading) indicators of consumer demand is an important task for monetary policy and regional management. The author correctly focuses on the Central Federal District, a macroregion where a significant part of effective demand is concentrated. This gives the work a practical focus. The novelty of the work manifested itself in applied research and practical recommendations. Leading indicator systems, including payment system data, enterprise monitoring, consumer confidence indices, and news tone, have been repeatedly proposed in research (including by the Bank of Russia) for the federal level. The author, in fact, adapts these approaches to the Central Federal District, but offers a system of methods for selecting or combining indicators. The absence of the predictive model itself (it is only announced in the conclusion) leaves the work at the stage of preliminary correlation analysis, which is a kind of claim to the real power of the selected variables in the future. In addition, a number of potentially leading indicators (for example, SBERINDEX) are available only in Russia as a whole, and not in the Central Federal District, which somewhat contradicts the stated regional focus. The presentation style is scientific. The structure is logical: introduction, review of sources, correlation analysis, conclusions. The figures and tables are informative. However, there is no actual forecast, which is a key element of the stated goal. The manuscript contains typos (for example, in Table 1 "Volume of car loans, mom sa%", etc., but in general the grammar is acceptable). The title of the article is somewhat inconsistent with the content, since the "formation of approaches" has not been completed with the construction of a predictive model. The list of references includes 50 sources, which is a sufficient number. Both classic works and modern publications (2021-2025) are presented. However, there are outdated sources (2004, 2008, 2009) that are not directly relevant to today's forecasting methods. The design of the bibliography generally complies with GOST R 7.0.100-2018, but there are some minor flaws (stable links are not indicated for some online sources, and publishing houses for books). The quality of the list as a whole can be considered satisfactory. The appeal to the opponents in the text of the article is implicit. There is no direct appeal to the opponents. The author provides various points of view on the choice of indicators, but does not enter into a discussion with those who question the effectiveness of consumer confidence indices or departmental statistics. The polemical component is weak, which somewhat reduces the scientific depth of the work. The conclusions are presented by a list of 13 indicators, which, according to the author, have a high correlation with the consumption index. However, the absence of an econometric model, false correlation testing, and predictive tests makes these conclusions preliminary and makes it impossible to use them fully in management practice. The article may be of interest to researchers as an overview of possible sources of advanced data. The journal of Theoretical and Applied Economics places high demands on empirical validity and novelty. The presented work contains a correlation analysis. The volume of the article and the bibliography meet the requirements, but the quality of the content is debatable. It seems that the presented article can be recommended for publication, but the author should be prepared for criticism and controversy over its conclusions and novelty.
Second Peer Review
Peer reviewers' evaluations remain confidential and are not disclosed to the public. Only external reviews, authorized for publication by the article's author(s), are made public. Typically, these final reviews are conducted after the manuscript's revision. Adhering to our double-blind review policy, the reviewer's identity is kept confidential.
The list of publisher reviewers can be found here.
Developing approaches to assessing consumer demand in the Central Federal District based on leading indicators The study of consumer demand based on leading indicators is of particular importance for improving the effectiveness of the Bank of Russia's monetary policy in achieving its goals, as it allows timely identification of changes in consumer behavior and assess their impact on inflationary processes. Such an assessment contributes to a more accurate forecasting of macroeconomic risks and the formation of informed decisions on the key interest rate and other regulatory instruments. This is also important for business, as the evaluation results can be used to more accurately predict market dynamics and timely adapt business development strategies. The presented article is devoted to the study of possible approaches to assessing consumer demand based on leading indicators, the development and testing of such an approach for the Central Federal District based on an analysis of the advantages and disadvantages of existing experience, the selection and justification of possible predictors. The purpose of the study is formulated by the author, it involves "the development of a system of indicators for assessing the dynamics of household consumer demand, based on open data with advanced properties and taking into account the characteristics of the macroregion, for their subsequent use in the construction of econometric forecasting models." The article highlights sections with subheadings, which corresponds to the presented requirements of the journal "Theoretical and Applied Economics". In the article, within the framework of the IMRAD approach, which has become classic for this kind of description of scientific results, 4 subsections are highlighted – "Introduction", "Materials and methods", "Results and discussion", "Conclusion". In the "Introduction" the author substantiates the relevance, purpose, and subject of the research. The research objectives are not highlighted. In the section "Materials and Methods", the author provides a detailed overview of domestic and foreign sources on existing approaches to assessing consumer demand based on leading indicators, as well as justifying the choice of these leading indicators. The author also describes the information database on consumer demand. It seems advisable to separate the literature review into a separate section with an appropriate subtitle. The section "Materials and methods" should be supplemented with a direct justification of the research methodology. The section "Results and discussion" is the main one in the article and reflects the author's results, as well as their testing in the regions of the Central Federal District. The author substantiates the choice of possible leading predictors of consumer demand. In the "Conclusion" section, the author summarizes the results of the study, summarizing that "based on the results of the study, based on the study of theoretical and practical work on the subject under study, as well as taking into account the evaluation of statistical information on indicators, the author proposed a system of indicators (including advanced ones) that best characterize household consumption in the Central Federal District and the corresponding analytical criteria (long-term dynamic series; unchanged calculation methodology, etc.)". As such indicators, the author selected indicators of consumer activity according to the Federal Tax Service of Russia from cash registers, Savings Index, dynamics of payments through the payment system of the Bank of Russia, real wages, the volume of consumer loans, inflationary expectations of the population, the index of the tonality of the press about retail, the index of large purchases, etc. The research uses well–known general scientific methods: analysis, synthesis, comparison, ascent from the abstract to the concrete, logical method, etc., as well as specific economic research methods - correlation and regression analysis, index method. The author actively uses the possibilities of illustrating the research results. The article contains 8 figures and 2 tables. The illustrative material helps to enhance the perception of the research results. In terms of design, we suggest that the author adjust the symbols of consumer demand indicators, for example, x1, x2, x3 ... The chosen research topic is extremely relevant. In conditions of high uncertainty typical of the modern Russian economy, it is strategically important to use a set of accurate indicators of consumer demand, which becomes one of the conditions for increasing the stability and competitiveness of the economy, for the correct application of monetary policy instruments. In conditions of high volatility and external shocks, the use of leading indicators is becoming an important element in ensuring price stability and sustainable development of the Russian economy. The article has practical significance in terms of suggestions on the use of leading indicators of consumer demand. These proposals can be applied by the Government and the Bank of Russia, relevant structures at the regional level, as well as businesses and commercial banks to predict consumer behavior. The scientific novelty of the research has not been formulated by the author, which requires an appropriate addition to the article. The style of the article is scientific and generally meets the requirements of the journal. The bibliography is represented by 50 sources, which exceeds the relevant requirements of the journal. The bibliography is formed primarily by domestic and foreign studies. There are current sources from recent years. The advantages of the article include the following. Firstly, the relevance and significance of the chosen research area. Secondly, the justification of the author's own approach to the research and selection of leading indicators of consumer demand. Thirdly, the availability of developed author's proposals for the development of investment attraction in the economy for Russia. Fourth, the wealth of literary review and illustrative material. The disadvantages include the following. First, there is the need to supplement the text of the article with a description of scientific novelty. Secondly, the need to separate the literature review into a separate section and supplement the article with a separate justification of the research methodology. Conclusion. The presented article is devoted to the study of possible approaches to assessing consumer demand based on leading indicators, the development and testing of such an approach for the Central Federal District based on an analysis of the advantages and disadvantages of existing experience, the selection and justification of possible predictors. The article can be accepted for publication in the journal of Theoretical and Applied Economics.
|

 Eng
Eng


