|
Sociodynamics
Reference:
Popov E.A., Zamyatina O.N., Pustovalova E.V., Koda E.A., Zamyatin I.D.
The main directions of measuring the quality of life of the rural population of the Kulundinsky district of the Altai Territory (Russia) using methods of mathematization of sociology
// Sociodynamics.
2023. ą 12.
P. 54-70.
DOI: 10.25136/2409-7144.2023.12.69236 EDN: VOYHZS URL: https://en.nbpublish.com/library_read_article.php?id=69236
The main directions of measuring the quality of life of the rural population of the Kulundinsky district of the Altai Territory (Russia) using methods of mathematization of sociology
Popov Evgeniy Aleksandrovich
ORCID: 0000-0003-3324-8101
Doctor of Philosophy
Professor, Department of Sociology and Conflictology, Altai State University
656049, Russia, Altai Territory, Barnaul, Dimitrova str., 66, office 520

|
popovea@mc.asu.ru
|
|
 |
Zamyatina Ol'ga Nikolaevna
ORCID: 0000-0002-3240-0098
PhD in Sociology
Associate Professor, Department of Sociology and Conflictology, Altai State University
656049, Russia, Altai Krai, Barnaul, Dimitrova str., 66, office 520D
|
|
olga_zamjtina@mail.ru
|
|
|
Other publications by this author
|
|
Pustovalova Elena Valer'evna
PhD in Philosophy
Associate Professor, Department of Sociology and Conflictology, Altai State University
656049, Russia, Altai Territory, Barnaul, Dimitrova str., 66, office 520
|
|
alenawalera@yandex.ru
|
|
|
Koda Egor Aleksandrovich
ORCID: 0009-0003-0682-1096
Graduate student, Department of Sociology and Conflictology, Altai State University
656049, Russia, Altai Krai, Barnaul, Dimitrova str., 66, office 520
|
|
kodaegor@yandex.ru
|
|
|
Other publications by this author
|
|
|
Zamyatin Ivan Denisovich
ORCID: 0009-0001-0653-0104
Student, Department of Economics and Management, National Research University Higher School of Economics
194100, Russia, Leningrad region, Saint Petersburg, Kantemirovskaya str., 3 bldg. 1, lit. A
|
|
vanechka.zamiatin@yandex.ru
|
|
|
Other publications by this author
|
|
|
DOI: 10.25136/2409-7144.2023.12.69236
EDN: VOYHZS
Received:
30-11-2023
Published:
07-12-2023
Abstract:
The article considers the possibility of measuring the quality of life of the rural population using the author's formulas on the example of the Kulundinsky district of the Altai Territory. The data obtained during the sociological research were integrated into the author's formulas and used to calculate the quality of life index and the real quality of life. The methodology of this work was based on a combination of structural functionalism and a systematic approach. The article presents the results of the author's sociological research, which was conducted in the period from 2022 to 2023. The empirical data obtained became the basis for the derivation and application of the author's formulas for the quality of life. In addition, the data obtained make it possible to reflect the current state of affairs in modern rural areas, as well as to characterize the quality of life of the rural population both in terms of objective and subjective components of quality of life. The process of researching the quality of life was carried out both by quantitative methods – a mass survey in the form of a questionnaire n=954, and by qualitative methods – a focus group n=108, an expert survey in the form of an in-depth interview n = 30, and an analysis of documents was also applied. The novelty of this work lies in measuring the quality of life of the rural population by applying two formulas: the quality of life index and the real quality of life. The results of the calculations completely coincide with the real state of affairs in the modern village, which gives the author the right to consider them workable and actually operating. The special value of this work lies in the possibility of extrapolating the methodology of this sociological study, in particular, the formulas of quality of life to other districts of the Altai Territory, as well as to other regions. This will allow the authorities to pinpoint and quickly identify problems in certain areas and resolve them promptly, which will lead to a further increase in objective and subjective indicators of the quality of life in modern rural areas.
Keywords:
Quality of life, The objective component, The subjective component, Perceived quality of life, Quality of Life Index, Measuring the quality of life, Rural life, The phenomenology of the village, Social optimism, Sociology of the village
This article is automatically translated.
You can find original text of the article here.
Currently, the issues of quality of life research are more relevant and in demand than ever both within the framework of scientific activity and within the framework of management activities. The existing socio-economic transformations of Russian society have an impact on all segments of the population, regardless of the region of residence and type of settlement. But it is worth noting that the rural population is most sensitive to certain transformational processes and crisis events. On the one hand, we are talking about the fact that rural areas have lower incomes compared to the city, and there are very few opportunities for upward social mobility, since the number of enterprises and vacancies in them is strictly limited [6]. Accordingly, a villager is forced to form a certain areola of stability in his life, which is reflected in the phenomenology of rural life, the working life of an individual, and so on. And in principle, changes of any kind are much more difficult for rural residents than for residents of other territories. The phenomenon of quality of life is a tool for analyzing the impact of all foreign policy, economic, and domestic political events on the livelihoods of the population, including the rural population. This is a fairly accurate indicator of the state of affairs in society as a whole, or in a particular locality in particular, since it reflects all kinds of components of the vital activity of society. The combination of economic, social, cultural, political and environmental components allows for a fairly clear and objective assessment of the situation in a certain locality [7]. Moreover, the quality of life category has sufficient extrapolation potential to make short- and medium-term forecasts regarding migration flows, social tension, industrial development, agriculture and a number of other fundamentally important categories. Also, with a detailed analysis of quality of life indicators, it is possible to identify the key problems of a particular locality and target these very problems. Indeed, there are other related categories with the quality of life, which one way or another can individually solve the above tasks. Nevertheless, the category of quality of life includes such a rich list of indicators and research categories, which allows it to be called a universal way to study the characteristics of life and vital activity in a particular locality or even region. Moreover, a well-chosen quality of life methodology has a sufficient degree of reliability to use it to investigate the situation in other districts, municipalities, regions or districts, of course, with some adjustments to the individual characteristics of the local population, for example, of a national or cultural nature [8]. Despite the presence of a number of advantages of this category, there is one significant drawback – the lack of a unified methodological approach to calculating the quality of life index. That is, there is no specific formula that would allow us to objectify the quality of life, and in addition, to compare quantitative indicators of the quality of life in some territories. Indeed, there are a number of methods for studying the quality of life, but all of them somehow go back to various introductory data that do not fully allow objectifying the quality of life. This means that the role of an accurate approach, which can be associated with the mathematization of sociology, is increasing. Consequently, even a competent specialist will find it difficult to compare the obtained parameters of the quality of life in two different territories. Therefore, the question remains open as to how to calculate the quality of life index, which the researcher should rely on when comparing quality of life indicators in different territories, which is why this work is relevant. The theoretical elaboration of this problem is at a fairly high level. For the first time, the concept of quality of life was applied by the American economist J. Galbraith in his work "The Society of Abundance". This work has become a kind of starting point for the universal use of the term quality of life. Over time, thanks to the fundamental works of D. Kobaa, Jones and K. Merat, the methodological basis of the phenomenon of quality of life expanded [4]. Russian sociologists also did not remain indifferent to the research and development of the concept of quality of life. Thus, the works of V.V. Babintseva and B.V. Bestuzhev-Lada served as a fundamental theoretical basis for the study of the quality of life in Russian sociological knowledge [3]. They described the main methodological constructions that are relevant to this phenomenon. In the works of T.I. Zaslavskaya and R.V. Ryvkina, not only theoretical constructions of the quality of life were considered in detail, but also a multifactorial analysis of the relationship with similar socio-economic categories, for example, such as lifestyle, lifestyle, social welfare, standard of living, and so on was carried out [5,11]. The methodological aspect of the study of the quality of life was also developed by domestic scientists: for example, in the works of L.S. Lebedev, the main indicators of the study of the quality of life of an objective nature are highlighted, and in the works of D.V. Petrosyants, special attention is paid to the subjective indicator of the quality of life and its features [12,15]. M.Yu. Juror developed a universal theoretical model of the quality of life, which includes eight basic components of quality of life [17]. Another author O.D. Rubaeva proposed options for an empirical study of the subjective component of the quality of life [19]. Altai sociologists also did not remain indifferent to the study of quality of life issues, as E.A. Popov and O.N. Zamyatina characterized the role of social optimism among the population of the Altai Territory as a component of quality of life in the short term [16]. At the same time, M.I. Cherepanova considered the relationship between social tension in rural areas and the category of quality of life [21]. Attempts to compile a formula for calculating the quality of life index were made earlier, but either they were reduced to calculating the human development index, or as in the works of A.G. Sizov and E.V. Prokopenko, a mathematical model for assessing the quality of social life of the population was formed [20]. Narrowing the concept of quality of life to the concept of the human development index is inappropriate, since there is a loss of consideration of a number of important indicators, both objective and subjective, and the mathematical model has not been reflected in some universal form. Despite the rather detailed elaboration of the problem both at the theoretical and methodological levels, the question remains how to actually measure and calculate the quality of life index. In addition, certain components of the quality of life may vary somewhat from author to author, and there is no clear methodological regulation of the study of the quality of life at all. Accordingly, the author of this work will propose his own methodology for studying the quality of life, as well as apply the developed formulas for the quality of life in practical calculations, which will constitute the novelty of this work. The purpose of this work is to measure the quality of life of the population of the Kulundinsky district of the Altai Territory by applying the author's formulas and research methods of this phenomenon.
The theoretical and methodological basis of the work is based on a systematic approach, as well as structural functionalism. The structural and functional approach allows us to identify the main components of the quality of life, to identify their role and functional purpose in calculating the overall quality of life index, and the systematic approach allows us to consider the objective and subjective components of the quality of life together, leading the study to logical harmony. First of all, it is extremely important to determine the phenomenon of quality of life within the framework of this work. So, the quality of life should be understood as a complex multidimensional category of a socio-economic nature, which includes a set of elements of the external environment, satisfaction with the economic, political, and social functioning of the social system, while it can receive a sociologically complete qualitative and quantitative expression [2]. The quality of life is a dual concept, since it includes two fundamental components, namely the objective component of the quality of life and the subjective component of the quality of life. The research interest is a set of these components, which is reflected in a system of signs, indicators and indicators directly related to a specific methodology of sociological research. Within the framework of the structural and functional approach, the available resources of individuals and households are reflected in objective indicators of quality of life. Objective indicators do not exist by themselves, they realize the individual's ability to achieve certain goals by solving certain tasks [1]. In addition to objective indicators, it is worth paying attention to the fact how the individual himself evaluates his capabilities, considers them sufficient or insufficient for vital activity, to what extent the individual is, in principle, set up to perform phenomenological operations [22]. In this context, a successful synthesis of the objective and subjective components of the quality of life is manifested. The subjective component of the quality of life is a set of socio-psychological indicators and assessments directly related to life satisfaction, the manifestation of various kinds of social affects, as well as the emotional coloring of one's own position in society and a certain social self-esteem. Two key features of the subjective component of the quality of life can be distinguished. Firstly, the special nature of this category implies the presence of both cognitive and affective parameters. Secondly, this category turns out to be extremely multidimensional, having a number of related, complementary terms, but at the same time all the terms considered in the framework of the dissertation research form the framework of the subjective component of quality of life, therefore, the category of subjective quality of life is generalizing for a number of other categories directly or indirectly related to the perceived quality of life [10]. The subjective component is an integral component of the quality of life, as it reflects the attitude of the population to almost all objective indicators: wages, work, municipal transport, healthcare, and so on. Accordingly, the objective components of the quality of life may well leave much to be desired, but if an individual feels like a full-fledged member of society, with a certain set of rights, duties and interests, then some objective shortcomings are simply offset by the subjective component of the quality of life. Moreover, it is important to consider the subjective component of the quality of life in the context of the social role performed by an individual, in fact, this will reflect his social status, which means that all subjective categories cease to be ephemeral and located in themselves, they will be reflected in those objective realities in which a particular individual lives [12]. It is important to note that the subjective component of the quality of life is a rather unstable category, since it can change even with slight fluctuations in various indicators of the outside world [14]. This component is given some stability by the fact that it relies on the direct objective components of the quality of life, as well as on the overall picture of the well-being of the population, the quality of the social environment. In fact, it is necessary to pay attention to the quality of the social environment in which empirical research is conducted: as part of the interpretation of the results obtained in a qualitative way, this will be an important support for the overall assessment of the results, since the social environment dictates to the individual what is considered an excellent quality of life, what is good, what is acceptable, and what is not at all appropriate, and unacceptable [9]. For example, for a representative of the rural intelligentsia, an indicator of personal safety, social security, generally speaking, an indicator of confidence in the future will be extremely important. While for marginal segments of the population there are completely different criteria for an acceptable quality of life, sometimes even irrational, for example, the absence of traffic police crews on the streets to be able to move by vehicle in any condition or the presence of retail outlets where it is possible to buy alcoholic beverages or tobacco products around the clock and on loan. The objective and subjective components of the quality of life can be reflected in total in eight basic indicators determined by M.Y. Juror. The identified indicators are universal in the sense that they can be reflected in both components of the quality of life. We are talking about such indicators as: personal safety, health, recreation, employment of an individual, physical environment, education, infrastructure, economic well-being of an individual [17]. In fact, the list of these indicators is not absolute, but among the available theoretical approaches, this list is the most complete. Thus, the health indicator includes the possibility of high-quality medical care, as well as the availability of equipped hospitals or FAPs in the locality. The learning indicator implies not only the current level of education of an individual, but also the possibility of obtaining an education. Accordingly, this indicator directly affects the possibility of vertical social mobility of an individual, which directly affects the subjective component of quality of life. The infrastructure indicator includes the main elements of the district economy of a recreational and leisure nature. As for the safety indicator, in this case we are talking about the crime rate, and the indicator of the physical environment includes the availability of housing, the condition of the housing itself, as well as the peculiarities of the environmental situation in this territory.
The sociological study of the quality of life is complex in a number of ways. Firstly, it is quite difficult to define a universal list of indicators of objective and subjective components of quality of life so that the overall assessment of quality of life is as close as possible to the real state of affairs [13]. Secondly, it is quite difficult to measure the main components of the subjective component of the quality of life with sociological tools, nevertheless, the formation of a competent methodology of sociological research allows us to level these limitations of sociological science. Thirdly, on the basis of which parameters to give a general assessment of the quality of life, indeed, the researcher receives a whole list of indicators of an objective and subjective nature, tries to bring them together, bring them to a common denominator, but so far it has not been possible to find a single reflection in some system of final indicators [18]. In fact, this difficulty leads to a rather difficult comparison of the quality of life in one territory in dynamics, if we are talking about a study of the quality of life by years over a certain period of time. The methodology of this sociological research was based on a combination of qualitative and quantitative methods. Qualitative methods were presented by an expert survey and a focus group, while quantitative methods were presented by a questionnaire. The use of such a set of methods is due to the need to increase the heuristic potential of this study, as well as to be able to control the obtained quantitative data with qualitative data. The thing is that the questionnaire questions aimed at identifying the subjective, perceived component of the quality of life do not always work properly due to the possible ambiguous interpretation by the respondent of the essence of what the researcher was interested in. Accordingly, the focus group conducted with the local population allows us to additionally collect material to assess the subjective component of the quality of life, as well as to identify those phenomenological and existential features of the village that allow us to characterize the phenomenon of modern rural life. Focus groups were held in each of the nine village councils located in Kulunda district. The sample of the focus group study was formed according to quotas in accordance with gender and age. Thus, 6 people were selected to participate in each focus group, respectively, 54 residents of the Kulunda district were interviewed within the framework of one act of the study. In total, 18 focus groups were conducted and processed during the designated period. Only 108 people took part in the focus groups, and some of the respondents could be repeated due to the low population of some rural councils. The frequency of focus groups is every six months. Thus, the focus group, like all methods, was implemented semi-annually in the period from September 2022 to November 2023, respectively, three full-fledged studies were conducted to characterize and assess the dynamics of quality of life. The focus group form consisted of 14 questions aimed at reflecting one or another component of the quality of life. If we return to the questionnaire survey, 318 people were interviewed every six months, with 174 female respondents and 144 male respondents. The selection of respondents was carried out in accordance with the nest sample, the village councils acted as nests. Within the nests, respondents were selected according to quotas according to gender and age. Relative to the general population N = 21000, the sample has sufficient representativeness and amounts to 954 people, while the respondents could partially repeat themselves. So in the district center itself, 206 people were interviewed each time and 112 people in villages and villages of the Kulundinsky district. The questionnaire consisted of a short instruction on filling out, an introduction and 75 closed questions reflecting the subjective and objective components of quality of life. At the same time, almost every question has a "Different" option, so as not to drive the respondent into a kind of dead end if the author of the questionnaire did not take into account one or another answer option initially at the development stage. The expert survey was aimed at identifying several parameters: on the one hand, the relationship between objective and subjective components of the quality of life, on the other hand, to identify those essential problems that really concern the population, can affect the subjective assessment of the quality of life, so that later they can be taken into account when processing and interpreting data. The experts were selected based on their position in the Kulunda district, and this may be either an active specialist or a specialist in retrospect. The experts were the heads, deputy heads and representatives of the leading positions of the following organizations: the Administration of the Kulundinsky district, village councils located in the district, the central district hospital, general education and preschool educational institutions, social protection institutions, deputies of the district assembly, as well as those persons who were elected to the Altai Regional Legislative Assembly as deputies. Thus, 10 experts were interviewed at each stage of the study, and the composition of experts was not repeated at each survey. A total of 30 expert surveys were conducted. The form of the expert survey consisted of a welcome speech and 18 main questions aimed at reflecting one or another component of the quality of life of a modern village.
After carrying out all the above stages, two main author's formulas were used to calculate the quality of life. The first formula is the real quality of life of the population indicator R of quality of life (Rc.zh.). It is aimed at identifying the ratio of subjective and objective components of quality of life to assess the actual quality of life. The subjective and objective components within this formula are represented by ten indicators with the same semantic and factor load, formed into a 10–point scale. The selection of subjective and objective indicators was carried out by a correlation analysis of each component with a certain general indicator of quality of life. The translation of the obtained research results into a 10–point scale was carried out as follows. Any results obtained were structured in ascending order from the worst indicator to the best. The obtained indicators were taken as a basis, where 1 is the worst indicator, and 10 is the highest indicator. After that, the existing difference between these indicators was divided into eight equal parts, which was a conditional one step on a ten-point scale. Based on the results obtained, the real quality of life in a particular territory is assessed. If the indicator of the real quality of life is more than one, this indicates an adaptation period in the life of the population, an increase in social optimism, as well as a high perceived level of subjective quality of life with low subjective indicators. In the event that the indicator of the real quality of life is less than one and at the same time tends to zero, then we are talking about a situation of deprivation when the population cannot meet basic needs, that is, both objective indicators and subjective indicators turn out to be low. In particular, if the indicator of the real quality of life is less than one and at the same time tends to one, then we are talking about dissonance, when objective characteristics of the quality of life turn out to be good, and subjective unsatisfactory. Such a situation can occur after a protracted crisis, when the population does not have the internal resources and vitality to really assess the current state of affairs. An ideal case is also possible when the real quality of life turns out to be balanced in the full sense of the word, then the indicator of the real quality of life is equal to one. 
Fig. 1. The formula of the real quality of life of the population Where R is the real level of quality of life, S is the subjective parameter of quality of life, O is the objective parameter of quality of life. S is a subjective parameter of quality of life – the average of ten key indicators according to a 10-point system. The subjective parameter of quality of life includes the following indicators: income, work, housing, health care, education, comfort of living, road condition, quality of communication, assessment of the work of district managers, ecology. O KJ is an objective parameter of the quality of life. The objective parameter of the quality of life includes the following indicators: average per capita income, employment, education, healthcare, housing, communications, roads, formal performance indicators of district leaders, leisure infrastructure, migration processes. The calculation system for each indicator is:  , where the numerator is the sum of all the above indicators on a 10–point scale, and the denominator is the total number of indicators. , where the numerator is the sum of all the above indicators on a 10–point scale, and the denominator is the total number of indicators. The second formula of the quality of life index is aimed at calculating a specific indicator of the quality of life, which gives reason to further compare and numerically represent the quality of life index as an independent scientific unit. Accordingly, the second formula has a greater extrapolation potential and heuristic value. In its most general form, this formula is the ratio of the sum of the product of the indicators of the objective and subjective components of the quality of life with a factor load and the sum of the indicators of the objective and subjective components of the quality of life. The quality of life index is expressed in %. The interpretation of the results is as follows: if the quality of life index is from 80 to 100%, then we are talking about a high quality of life, if the result is from 60 to 80%, then we are talking about a good quality of life, if the result is from 50 to 60%, then we are talking about a normal quality of life, in the case if the results are 30-50%, then we are talking about a lower-than-average quality of life, and if the results are less than 30%, then we are talking about an unsatisfactory quality of life. The above gradation is based on the one hand on the ability of the population to meet the basic needs necessary for life, as well as needs that are not directly related to ensuring their own life, for example, the need for an expensive car, on the other hand, we are talking about subjective assessments of the availability of opportunities to meet basic needs, as well as an assessment of their own position in society and perceptions of the state of affairs in society. 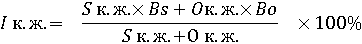
Fig. 2. The formula of the quality of life index of the population Where I is the index of quality of life, S is the subjective parameter of quality of life, O is the objective parameter of quality of life, Bs is the average correlation between the factors of the subjective component of quality of life, V is the average correlation between the factors of the objective component of quality of life. The quality of life factors obtained as a result of the above-described correlation analysis are subjected to factor analysis to identify the essential relationships between themselves and the general category of quality of life. The correlation load between these factors is the fundamental component that represents the Bs and He indicators.
The question of the main components of the subjective and objective components of the quality of life also remains relevant. Despite the generally accepted inclusion of over 30 main components, the real research sense based on the Pearson correlation will have only 10 indicators of subjective and 10 indicators of objective components of quality of life. Moreover, if in the sense of some components of the objective and subjective components are weakly related to each other, then from the point of view of factor analysis, there is a fairly close load relationship between such components in relation to the general category of quality of life. It is obvious that a positive correlation indicates a direct relationship between a specific component and a general indicator of quality of life, and a negative correlation indicates an inverse relationship between a variable and a general indicator of quality of life. The subjective component includes the following 10 components. All of them have a positive correlation, that is, an increase in satisfaction with these indicators leads to an increase in the overall assessment of the quality of life. The following indicators will be listed: income, work, housing, health, education, living comfort, road condition, communication quality, assessment of the work of district leaders, as well as ecology. The author considered the correlation, which is higher than 0.4 according to Pearson, to be significant. As for the objective component, the following main components were highlighted: per capita income, employment, education, health, housing, communications in the area, road infrastructure, performance indicators of district leaders, leisure and migration. Moreover, the migration indicator has a negative correlation with the phenomenon of quality of life, respectively, the higher the migration, the lower the quality of life and vice versa. The correlation value is shown in Table 1. Table 1. Correlations between the subjective, objective components and the overall assessment of the quality of life. | Indicator | Correlation (Pearson) | | The subjective component | | Income | +0,851** | | Work | +0,774* | | Housing | +0,516 | | Healthcare | +0,879** | | Education | +0,699* |
| The comfort of living | +0,598* | | Road conditions | +0,560 | | Communication quality | +0,412 | | Assessment of the work of district managers | +0,456 | | Ecology | +0,668* | | The objective component | | Per capita income | +0,901** | | Employment of the population | +0,805** | | Education | +0,558 | | Healthcare |
+0,478 | | Housing | +0,651* | | Communication in the area | +0,551 | | Road infrastructure | +0,775** | | Performance indicators of district managers | +0,401 | | Leisure | +0,600* | | Migration | –0,901** | If we consider the specific factors in the Kulunda district that positively affect the phenomenon of quality of life, then the following components can be distinguished. The population of the district receives wages in the region among rural settlements above the average, respectively, and wage satisfaction is at a level, especially taking into account the availability of a normal and comfortable employment schedule. The overall unemployment rate is at 3%, which is an excellent result for a modern rural area. The general rise of industry in the area after a long stagnation also has a positive effect on the overall quality of life: the MKK – dairy and canning plant, as well as the Kulundinsky elevator, have been operating at almost full capacity. The fact that the absolute majority of residents of the district are the owners of their residential premises, and the condition of these premises is good and is constantly improving, gives reason to believe that the population feels quite comfortable in this area, trying in every possible way to improve their living conditions. By the way, the living conditions of the population of the district are also improving every year: long-burning boilers, a bathroom in the house, the presence of a shower cabin and a comfortable bathhouse "in white" on the territory of a private house are becoming the norm. Gorenje. The transport infrastructure of the district also demonstrates positive dynamics: the age–old problem is being solved not only with municipal transport, but also the transport accessibility of the regional capital – the city of Barnaul, as well as the city of Novosibirsk and the nearest large settlement, in the recent past, the city of Slavgorod. For the population, it is extremely important to be able to get to the place of potential treatment without transfers, since through the efforts of the CRH it is not always possible to make the correct diagnosis and prescribe adequate treatment. Not everything is unambiguous with the environmental situation in the area, on the one hand, the measures taken to isolate the landfill from the settlement are yielding results, but, on the other hand, the consequences of the garbage reform minimize such results. The clean-up days regularly conducted by initiative groups together with the district Administration and village councils, not only on the territory of the district center, but also in summer recreation areas of the Kulundinsky district, give their definitely positive results.
The population is faced with a whole list of negative components that negatively affect the overall assessment of the quality of life of the population in the area. If earlier the population was not strongly dependent on the prices of meat and animal products, as well as on the prices of vegetable products, now the practice of running a personal subsidiary farm is becoming a thing of the past due to its unprofitability. The key problem of the district, which negatively affects the quality of life, is healthcare, because the shortage of personnel, huge queues for doctor's appointments do not always make it possible to provide high-quality medical care. Problems with medical care, some difficulties in the educational system – all these are the consequences of poorly organized optimization, as a result of which some of the medical institutions of the district were closed, some fell into final decline, a similar situation with pre-school education institutions. The formed directive management of preschool educational institutions does not actually fulfill the tasks assigned to it, as a result, the population is forced to take their children not to the nearest kindergarten, but to the kindergarten that managers consider necessary and important. Also, the condition of the roadway leaves much to be desired, despite the presence of certain positive dynamics, since some sections of the roadway have been left without repair for many years and require the close attention of competent services. When making a general assessment of the quality of life, it should be understood that there are disadvantages in any municipality, but, objectively, there are much more positive elements in the life of the Kulundinsky district. The process of assessing the quality of life of the population of Kulunda district was based on the application of the two formulas described above. In 2022, there was an adaptation period of the population to new realities, as there was a high indicator of the subjective component of the quality of life, but at the same time objective indicators were lowered. The adaptation period is characterized by high social optimism of the population and irrational social happiness. R life span = 1,712. In the first half of 2023, deprivation was observed, as both the objective parameters of the quality of life for a number of elements and the subjective ones decreased. In fact, the population is faced with a situation where existing needs cannot be met due to rising prices, inaccessible loans, etc. R quality of life = 0.557. In the second half of 2023, the situation changed somewhat, the indicators of the objective and subjective components came to a certain equilibrium, that is, those parameters that were at a high level according to the objective indicator received a high subjective assessment and vice versa. Accordingly, R quality of life = 0.901, we can state a conditionally normal indicator of the quality of life of the population. But this formula reveals only the ratio of subjective and objective indicators, without giving an exhaustive description of the quality of life index as such. The calculation of the quality of life index was carried out according to formula No. 2 (see the Methodology). If in 2022 the quality of life index was 64.3%, which is an indicator above the average, then in the first half of 2023 the quality of life index significantly decreased, due to a decrease in both objective and subjective parameters of quality of life – 57%. In this case, we can talk about a normal quality of life when all indicators are in a certain average state. Positive trends in the socio-economic transformation of the village led to a slight increase in the quality of life index in the second half of 2023 to 65.1%, which again raised the quality of life indicator to the "above average" level. Such fluctuations may continue from year to year until a certain level of social, political and economic equilibrium is reached. Moreover, the process of socio-economic transformation of the village itself is not linear, it is characterized by both ups and downs in the short term, and the political and economic agenda is also not very stable, respectively, and the index can vary from year to year within 10-12%, which can be called a conditional norm. Moreover, such noticeable fluctuations over the course of six months are quite normal, since the rural population reacts most acutely to all even minor changes in all spheres of society, with the only caveat that remote villages and villages where a very small number of residents live in principle quite stable in almost any state of affairs. Thus, a sociological study of the dynamics of the quality of life in the Kulunda district was conducted. It is worth noting that the population of the Kulundinsky district lives quite steadily, despite the presence of a number of socio-economic transformations faced by the modern village. The use of the author's formulas for calculating the real quality of life and the quality of life index made it possible to give a mathematical assessment of the quality of life of the population in the Kulundinsky district of the Altai Territory. In the second half of 2023, the indicator of the real quality of life (R=0.901) indicates the absence of excesses in the identification of the population's own quality of life, since with such an indicator, the objective state of affairs is almost completely correlated with the subjective assessment of the population. That is, objective realities have become, on the whole, understandable and comfortable for the population, respectively, the Kulundin people assess these realities as conditionally normal and acceptable. The quality of life index in the second half of 2023 turned out to be 65.1%, which gives reason to assess the quality of life of the population of Kulunda district as above average. There is an obvious need for further improvement of the quality of life methodology and extrapolation of the methodology and these formulas not only to the Altai Territory, but also throughout Russia. Calculating the quality of life using such an author's methodology can be useful both for managers of a particular territory and for statistical agencies to generate annual reports. In fact, the components of the quality of life reflected in the formulas will have an indicative character about the presence of problems in a particular territory.
References
1. Antonova, O. A. (2022). The quality of life of the population and the quality of working life. Bulletin of Chelyabinsk State University, 6(464), 30-41. doi:10.47475/1994-2796-2022-10604
2. Akhmedova, A.R., Sterlyadeva, N.A., Koda, E.A., Oleinikova, E.P., & Lapteva, D.N. (2022). The quality of life of the population as an indicator of social development (on the example of a sociological study in the Kulundinsky district of the Altai Territory). Sociodynamics, 8, 26-37. doi:10.25136/2409-7144.2022.8.38780
3. Babintseva, V. P., Brazhnik, G. V., & Shevchenko, N. V. (2015). Formation and reproduction of the social capital of the rural population. Belgorod: Epicenter LLC, 192.
4. Bazhenov, S.A., & Malikov, N.S. (2020). The quality of life of the population: theory and practice. Standard of living of the population of the regions of Russia, 10, 10-43.
5. Barsukova, S. Yu. & Ryvkina, R.V. (1998). Economic sociology of transitional Russia: People and reforms. Sociological Journal, 3-4, 283-286.
6. Varaksina, N.V., Varaksin, S.V., Zamyatina, O.N., Koda, E.A., & Zamyatin, I.D. (2023). Assessment of the dynamics of the quality of life of the population of the Kulundinsky district of the Altai Territory. Sociodynamics, 8, 33-46. doi:10.25136/24097144.2023.8.44100
7. Danilenko, K.V., & Leonova, A.V. (2017). The level and quality of life of the population as an object of forecasting. Skif, 9, 106-111.
8. Danilova, T. O. (2021). Definition and essence of the concept of quality of life of the population. Science and education today, 2(61), 48-49.
9. Dekhanova, N. G., Sushko, V. A., & Kholodenko, Yu. A. (2023). Social capital as a factor in the formation of quality of life. Sociology, 1, 86-96.
10. Zakharova, E. N., Leontieva, A.V., & Rykovskaya, O. O. (2022). Quality of life and its components. Innovative economics: prospects for development and improvement, 5(63), 22-28.
11. Kutsenko, O. D. (2014). Contribution of T. I. Zaslavskaya to the theory of the social structure of society. Sociological Journal, 3, 140-156. doi:https://doi.org/10.19181/socjour.2014.3.517
12. Lebedeva, L.S. (2018). Quality of life": key approaches and the structure of the concept. Monitoring, 4(146), 68-80. doi:10.14515/monitoring.2018.4.04
13. Morozova, M.A. (2019). Methodological approaches to assessing the level and quality of life of the population. International Journal of Humanities and Natural Sciences, 5(3), 135-138. doi:10.24411/2500-1000-2019-10988
14. Nekhoda, E. V., Roshchina, I. V., & Pak, V. D. (2018). Quality of life: measurement problems. Vestn. Volume. State University. Economy, 43, 107-122. doi:10.17223/19988648/43/7
15. Petrosyants, D. V. (2022). Quality of life and social determinants. Power, 30(6), 83-88.
16. Popov, E. A., & Zamyatina, O. N. (2021). A ray of light in the dark kingdom": social optimism of the population of the Altai Territory in the short term. Vestn. Volume of the State University. Philosophy. Sociology. Political science, 59, 167-179. doi:10.17223/1998863Ő/59/16
17. Prisyazhny, M. Yu. (2011). Approaches to the definition of the concept of "Quality of life". Actual problems of humanities and natural sciences, 5, 283-295.
18. Pynko, L. E. (2017). The quality of life of the population in the regional dimension: an economic and statistical analysis. Power and management in the East of Russia, 69-77. doi:78-1-69-76
19. Rubaeva, O. D. (2018). Algorithm of management of sustainable socio-economic development of the village (on the materials of the Chelyabinsk region). Agrarian Bulletin of the Urals, 11(117), 88-92.
20. Sizov, A. G., & Prokopenko, E. V. (2013). A mathematical model for assessing the level of health and quality of human social life. Fundamental and applied research: problems and results, 9, 50-54.
21. Cherepanova, M. I. & Saryglar, S. A. (2015). Social potential of interethnic tension of the population of the Altai Territory. Lomonosov readings in Altai: fundamental problems of science and education: Collection of scientific articles of the international conference, 3348-3349.
22. Shchitova, N.A., Belozerov, V.S., & Tikunov, V.S. (2019). Socio-economic component of assessing the quality of life of rural population. Bulletin of the Moscow University. Series 5: Geography, 5, 69-77.
Peer Review
Peer reviewers' evaluations remain confidential and are not disclosed to the public. Only external reviews, authorized for publication by the article's author(s), are made public. Typically, these final reviews are conducted after the manuscript's revision. Adhering to our double-blind review policy, the reviewer's identity is kept confidential.
The list of publisher reviewers can be found here.
The subject of the research in the presented article is the main directions of measuring the quality of life of the rural population of the Kulundinsky district of the Altai Territory at the level of mathematization of sociology. General scientific methods such as analysis, categorization method, descriptive method were used as the methodology of the subject area of research in this article, and a systematic approach and structural functionalism were also applied during the research. The methodology of this sociological research was based on a combination of qualitative and quantitative methods. Qualitative methods were presented by an expert survey and a focus group, and quantitative methods were presented by a questionnaire. The relevance of the article is beyond doubt, since the existing socio-economic transformations of Russian society have an impact on all segments of the population, regardless of the region of residence and type of settlement. But it is worth noting that the rural population is most sensitive to certain transformational processes and crisis events. On the one hand, we are talking about the fact that rural areas have lower incomes compared to the city, and there are very few opportunities for upward social mobility, since the number of enterprises and vacancies in them is strictly limited. Accordingly, a villager is forced to form a certain areola of stability in his life, which is reflected in the phenomenology of rural life, the working life of an individual, and so on. And, in principle, changes of any kind are much more difficult for rural residents than for residents of other territories. The scientific novelty of the research lies in conducting research using the author's methodology. Thus, a focus group conducted with the local population allowed us to additionally collect material to assess the subjective component of the quality of life, as well as to identify those phenomenological and existential features of the village that allow us to characterize the phenomenon of modern rural life. Focus groups were held in each of the nine village councils located in Kulunda district. The sample of the focus group study was formed according to quotas in accordance with gender and age. Thus, 6 people were selected to participate in each focus group, respectively, 54 residents of the Kulundinsky district were interviewed within the framework of one act of the study. In total, 18 focus groups were conducted and processed during the designated period. Only 108 people took part in the focus groups, and some of the respondents could be repeated due to the low population of some rural councils. In the questionnaire, 318 people were interviewed every six months, with 174 female respondents and 144 male respondents. The selection of respondents was carried out in accordance with the nest sample, the village councils acted as nests. The study was conducted from September 2022 to November 2023. The experts were the heads, deputy heads and representatives of the leading positions of the following organizations: the Administration of the Kulundinsky district, village councils located in the district, the central district hospital, general education and preschool educational institutions, social protection institutions, deputies of the district assembly, as well as those persons who were elected to the Altai Regional Legislative Assembly as deputies. Thus, 10 experts were interviewed at each stage of the study, and the composition of experts was not repeated at each survey. A total of 30 expert surveys were conducted. After carrying out all the above stages, two main author's formulas were used to calculate the quality of life. The article is presented in the language of scientific style with a very competent use in the text of the study of the presentation of various positions on the problem under study, as well as scientific terminology and definitions on the topic of the study. The structure is designed taking into account the basic requirements for writing scientific articles. The structure of this study includes an introduction, scientific elaboration of the problem, methodological tools, research results, conclusions and bibliography. The content of the article reflects its structure. The article notes that the sociological study of the quality of life is complex in a number of parameters. Firstly, it is quite difficult to define a universal list of indicators of the objective and subjective components of the quality of life so that the overall assessment of the quality of life is as close as possible to the real state of affairs. Secondly, it is quite difficult to measure the main components of the subjective component of the quality of life with sociological tools, nevertheless, the formation of a competent methodology of sociological research allows us to level these limitations of sociological science. Thirdly, on the basis of which parameters to give an overall assessment of the quality of life, indeed, the researcher receives a whole list of indicators of an objective and subjective nature, tries to bring them together, bring them to a common denominator, but so far it has not been possible to find a single reflection in some system of final indicators. The bibliography contains 22 sources, including domestic periodicals and non-periodicals. The article describes various positions and points of view of well-known scientists characterizing approaches and various aspects of considering the quality of life, its parameters, the possibility of their assessment, and also contains an appeal to various scientific works and sources devoted to this topic, which is included in the circle of scientific interests of researchers dealing with this issue. The presented study contains brief conclusions concerning the subject area of the study. In particular, it is noted that the use of the author's formulas for calculating the real quality of life and the quality of life index made it possible to give a mathematical assessment of the quality of life of the population in the Kulundinsky district of the Altai Territory. In the second half of 2023, the indicator of the real quality of life (R=0.901) indicates the absence of excesses in the identification of the population's own quality of life, since with such an indicator, the objective state of affairs is almost completely correlated with the subjective assessment of the population. That is, objective realities have become, on the whole, understandable and comfortable for the population, respectively, the Kulundin people assess these realities as conditionally normal and acceptable. The quality of life index in the second half of 2023 turned out to be 65.1%, which gives reason to assess the quality of life of the population of Kulunda district as above average. There is an obvious need for further improvement of the quality of life methodology and extrapolation of the methodology and these formulas not only to the Altai Territory, but also throughout Russia. In fact, the components of the quality of life reflected in the formulas will have an indicative character about the presence of problems in a particular territory. The materials of this study are intended for a wide range of readers, they can be interesting and used by scientists for scientific purposes, teaching staff in the educational process, regional leaders, state and municipal officials, economists, politicians and analysts. As disadvantages of this study, it should be noted that the structural elements of the study, which undoubtedly exist in the content of the article, are not highlighted by separate headings. When designing the text of the study, it would be possible to use drawings for clarity. When preparing the study, it was also possible to refer to foreign sources and include them in the bibliographic list. These shortcomings do not reduce the high scientific and practical significance of the study itself, but rather relate to the design of the text of the article. It is recommended to publish the article.
|

 Eng
Eng


